Distances and travel times to ART facilities for PLHIV
March 2022
Overview
The goals of this analysis are:
- For given travel times (60, 90, 120 minutes) or geographical distances (5, 8, 10 km), estimate the proportion and number of PLHIV that can reach their closest ART facility. This is done on a district and traditional authority (TA) level.
- Produce a gridded PLHIV prevalence map of Malawi using the WorldPop population density map and Naomi PLHIV estimates that supports the identification of locations that may be underserved.
- Incorporate travel time maps that indicate the time and distance needed to reach the closest ART facilities, based on a combination of digital elevation and land cover maps as well as road layouts in Malawi.
- Identify and propose new candidate facilities and locations for ART treatment scaling-up activities.
For the detailed methodology on how these maps were created, please refer to the supplementary material provided.
Malawi Maps
Population, PLHIV and Travel Times
Malawi Overview Map
Each pixel on the map corresponds to an area of 1km x 1km. Below we display a map of Malawi with some general information:
- Population: population density using the WorldPop population density map, adjusted to the 2018 census numbers.
- PLHIV: gridded prevalence estimates of the number of people living with HIV (“PLHIV density estimates”).
- HIV Prevalence: estimated gridded HIV prevalence.
- Geographical distance: direct distance (in km) to the closest ART facility.
- Walking time: estimated travel time (in minutes) to the closest ART facility at a given pixel.
Additionally, it is possible to add markers with facility locations to the map:
- ART Facilities: health facilities that provide ART services and had at least one patient on ART in 2020 (based on the DHA-MIS database).
- “Private for profit” facilities are excluded from the analysis.
- The number of ART patients in Q3/2020 is provided in the brackets.
- Non-ART Facilities (Static): other (nonprofit) health facilities that do not currently provide ART facilities. (These include facilities that have indicated that they have capacity to provide ART services).
Time and Distance Thresholds
By comining the travel time maps with the gridded PLHIV prevalence, the number of PLHIV that is not reached within a certain time limit or distance (km) is computed. This is visualised in the below two maps, stratified by geographical distance and walking time.
Example interpretations:
- Walking 15 minutes: this gives a map of the regions with PLHIV for which the closest facility is more than 15 mintues (walking time) away.
- 5km distance: this gives a map of the regions with PLHIV for which the closest facility is more than 5km (geographical distance) away.
Geographical Distance
Walking Time
District/TA analysis
To support the analysis, we have computed the proportion of PLHIV that is not reached within a given time or distance. Higher percentages correspond to a larger proportion of PLHIV that is not reached within the relevant area.
District Level (%PLHIV)
District Level (Nr. PLHIV)
TA Level (%PLHIV)
TA Level (Nr. PLHIV)
Proposed Facilities & Locations
Below we provide analyse the proposed facilities and locations for scaling-up activities. The top 25 facilities and locations are illustrated on the maps. Green areas indicate additional PLHIV that can be reached through the proposed facilities and locations.
Candidate Facilities (60 Minutes)
| ID | Source | District | TA | Name | Type | Authority | Long. | Lat. | PLHIV | 95% CI |
|---|---|---|---|---|---|---|---|---|---|---|
| 2561 | SARA | Mangochi | TA Chimwala | Assalam Clinic | Clinic | CHAM or mission/faith-based | 35.19 | -14.55 | 1487 | (1054-1982) |
| 1088 | DHAMIS | Thyolo | TA Bvumbwe | BLM Bvumbwe | Special / other site | Indep NGO | 35.08 | -15.93 | 1407 | (1106-1747) |
| 3337 | SARA | Chikwawa | TA Makhwira | Mitondo Health Post | Health Post | Government/public | 35.06 | -16.27 | 1118 | (770-1570) |
| 2992 | SARA | Blantyre City | Mapanga Ward | Amitofo Care Centre | Clinic | Indep NGO | 35.11 | -15.75 | 1852 | (1483-2287) |
| 2630 | SARA | Machinga | STA Nsanama | MOLIPA | Health Post | Government/public | 35.39 | -15.05 | 851 | (585-1182) |
| 3713 | SARA | Neno | TA Symon Likongwe | Zalewa DAPP VCT Station | Clinic | Indep NGO | 34.85 | -15.45 | 821 | (588-1082) |
| 4065 | SARA | Lilongwe | TA Masumbankhunda | DZABWA | Health Post | CHAM or mission/faith-based | 33.57 | -14.10 | 826 | (565-1157) |
| 673 | DHAMIS | Lilongwe City | Area 38 | Chimwala Health Centre | Health centre | Government/public | 33.80 | -14.05 | 792 | (579-1024) |
| 1322 | DHAMIS | Machinga | TA Chikweo | Chipolonga Health Post | Health post | Government/public | 35.69 | -14.86 | 804 | (524-1151) |
| 3304 | SARA | Chikwawa | TA Ngabu | Chapwaila Health Centre | Health Centre | Government/public | 34.78 | -16.40 | 782 | (539-1087) |
| 1434 | SARA | Salima | Salima Town | Ndimoyo Palliative Trust Clini | Clinic | Indep NGO | 34.46 | -13.78 | 764 | (551-1013) |
| 3163 | SARA | Thyolo | TA Mphuka | CHILENGO | Health Post | Government/public | 35.02 | -16.14 | 1073 | (763-1406) |
| 1410 | DHAMIS | Zomba | TA Mwambo | Mikuyu Adult Clinic | Special / other site | Government/public | 35.42 | -15.42 | 639 | (493-804) |
| 2820 | SARA | Chiradzulu | TA Mpama | NJULI | Health Post | Government/public | 35.12 | -15.71 | 1791 | (1451-2191) |
| 3257 | SARA | Mulanje | TA Nkanda | DEMULA | Health Post | CHAM or mission/faith-based | 35.48 | -15.96 | 605 | (455-790) |
| 3351 | SARA | Chikwawa | TA Ngabu | THERERE | Health Post | Government/public | 34.68 | -16.37 | 619 | (368-929) |
| 3244 | SARA | Mulanje | TA Mabuka | Sayama Clinic | Clinic | Company, ESCOM, Tea Estate (SARA) | 35.55 | -16.07 | 578 | (449-719) |
| 1158 | DHAMIS | Zomba | TA Mkumbira | Chisi Health Centre | Health centre | Government/public | 35.61 | -15.33 | 598 | (364-939) |
| 3259 | SARA | Mulanje | TA Chikumbu | KHAYA | Health Post | CHAM or mission/faith-based | 35.39 | -15.99 | 595 | (461-752) |
| 1393 | DHAMIS | Dedza | TA Chilikumwendo | Mdeza Dispensary | Dispensary | Government/public | 33.97 | -14.24 | 575 | (388-827) |
| 3246 | SARA | Mulanje | STA Sunganinzeru | CHILINGWE | Dispensary | Company, ESCOM, Tea Estate (SARA) | 35.65 | -16.00 | 544 | (395-720) |
| 1850 | SARA | Ntcheu | TA Goodson Ganya | Solomon Village Clinic | Clinic | CHAM or mission/faith-based | 34.87 | -14.71 | 538 | (362-734) |
| 2556 | SARA | Mangochi | STA Chiunda | Mbalama Dispensary | Dispensary | Government/public | 35.50 | -14.71 | 527 | (361-748) |
| 3356 | SARA | Chikwawa | TA Ngabu | SAOPA | Health Post | Government/public | 34.82 | -16.49 | 568 | (401-775) |
| 3416 | SARA | Nsanje | TA Tengani | Mkango Health Post | Health Post | Government/public | 35.30 | -16.82 | 510 | (326-734) |
Candidate Facilities (90 Minutes)
| ID | Source | District | TA | Name | Type | Authority | Long. | Lat. | PLHIV | 95% CI |
|---|---|---|---|---|---|---|---|---|---|---|
| 3337 | SARA | Chikwawa | TA Makhwira | Mitondo Health Post | Health Post | Government/public | 35.06 | -16.27 | 1107 | (765-1545) |
| 3338 | SARA | Chikwawa | TA Makhwira | Nkhate Health Post | Health Post | Government/public | 34.96 | -16.15 | 1090 | (747-1495) |
| 3351 | SARA | Chikwawa | TA Ngabu | THERERE | Health Post | Government/public | 34.68 | -16.37 | 848 | (522-1242) |
| 2630 | SARA | Machinga | STA Nsanama | MOLIPA | Health Post | Government/public | 35.39 | -15.05 | 798 | (535-1142) |
| 2577 | SARA | Mangochi | TA Chimwala | MWATAKATA | Health Post | Government/public | 35.11 | -14.76 | 764 | (522-1047) |
| 1158 | DHAMIS | Zomba | TA Mkumbira | Chisi Health Centre | Health centre | Government/public | 35.61 | -15.33 | 598 | (364-939) |
| 2632 | SARA | Machinga | STA Nchinguza | LIKHONYOWA | Health Post | Government/public | 35.79 | -14.96 | 620 | (307-1167) |
| 1322 | DHAMIS | Machinga | TA Chikweo | Chipolonga Health Post | Health post | Government/public | 35.69 | -14.86 | 549 | (345-828) |
| 3331 | SARA | Chikwawa | TA Lundu | SUCOMA Lengwe | Clinic | Company, ESCOM, Tea Estate (SARA) | 34.80 | -16.20 | 533 | (356-755) |
| 4065 | SARA | Lilongwe | TA Masumbankhunda | DZABWA | Health Post | CHAM or mission/faith-based | 33.57 | -14.10 | 519 | (345-746) |
| 390 | DHAMIS | Karonga | TA Kyungu | Mlare Health Post | Health post | Government/public | 34.04 | -10.17 | 539 | (306-880) |
| 1850 | SARA | Ntcheu | TA Goodson Ganya | Solomon Village Clinic | Clinic | CHAM or mission/faith-based | 34.87 | -14.71 | 517 | (351-720) |
| 2764 | SARA | Zomba | TA Mkumbira | LUNGAZI | Health Post | Government/public | 35.85 | -15.42 | 533 | (245-968) |
| 2571 | SARA | Mangochi | TA Chimwala | St. Johns Seminary | Clinic | CHAM or mission/faith-based | 35.18 | -14.55 | 489 | (349-656) |
| 3416 | SARA | Nsanje | TA Tengani | Mkango Health Post | Health Post | Government/public | 35.30 | -16.82 | 460 | (290-664) |
| 1059 | SARA | Kasungu | STA M’nyanja | MAFUPHIZI | Health Post | Government/public | 33.44 | -12.71 | 437 | (263-677) |
| 3355 | SARA | Chikwawa | TA Ngabu | KHOKHWA | Health Post | Government/public | 34.85 | -16.53 | 418 | (270-618) |
| 3415 | SARA | Nsanje | TA Makoko | Ching’oma Health Post | Health Post | Government/public | 35.11 | -17.00 | 418 | (259-620) |
| 2763 | SARA | Zomba | TA Mkumbira | CHINGUMA | Health Post | Government/public | 35.80 | -15.23 | 442 | (212-788) |
| 2572 | SARA | Mangochi | TA Makanjila | LUKOLOMA | Dispensary | Government/public | 35.10 | -13.83 | 416 | (218-713) |
| 4072 | SARA | Lilongwe | TA Kalumbu | NYANJA | Health Post | Government/public | 33.94 | -14.14 | 391 | (256-581) |
| 1842 | SARA | Ntcheu | TA Masasa | Phanga Dispensary | Dispensary | Government/public | 34.72 | -14.34 | 357 | (239-507) |
| 1630 | SARA | Mchinji | STA Pitala | PITALA | Health Post | Government/public | 33.03 | -13.55 | 338 | (220-493) |
| 1184 | DHAMIS | Mchinji | STA Gumba | Chimwamkango Health Centre | Health centre | Government/public | 32.99 | -13.40 | 334 | (191-539) |
| 1331 | DHAMIS | Mchinji | TA Kazyozyo | Kazyozyo Health Centre | Health centre | Government/public | 32.86 | -13.58 | 318 | (184-532) |
Candidate Locations (60 Minutes)
| ID | District | TA | Long. | Lat. | PLHIV | 95% CI |
|---|---|---|---|---|---|---|
| 1 | Chiradzulu | TA Mpama | 35.12 | -15.73 | 2286 | (1841-2874) |
| 2 | Mangochi | TA Chimwala | 35.18 | -14.50 | 1624 | (1166-2162) |
| 3 | Phalombe | TA Jenala | 35.63 | -15.52 | 1620 | (954-2316) |
| 4 | Thyolo | STA Boyidi | 35.13 | -15.93 | 1532 | (1204-1916) |
| 5 | Phalombe | TA Chiwalo | 35.76 | -15.61 | 1484 | (1051-2008) |
| 6 | Mulanje | TA Nkanda | 35.43 | -15.87 | 1463 | (1056-1915) |
| 7 | Zomba | STA Ngwelero | 35.50 | -15.58 | 1409 | (1214-1812) |
| 8 | Chikwawa | TA Makhwira | 34.99 | -16.18 | 1371 | (989-1874) |
| 9 | Mangochi | TA Chimwala | 35.17 | -14.72 | 1317 | (839-1931) |
| 10 | Mangochi | TA Nankumba | 34.94 | -14.18 | 1242 | (881-1801) |
| 11 | Chikwawa | STA Ndakwela | 34.77 | -16.18 | 1178 | (823-1629) |
| 12 | Mulanje | TA Laston Njema | 35.78 | -16.01 | 1153 | (839-1533) |
| 13 | Salima | TA Khombedza | 34.38 | -13.54 | 1117 | (976-1334) |
| 14 | Phalombe | TA Mkhumba | 35.59 | -15.69 | 1102 | (897-1511) |
| 15 | Salima | TA Pemba | 34.48 | -13.82 | 1089 | (889-1517) |
| 16 | Chikwawa | TA Makhwira | 35.05 | -16.28 | 1119 | (755-1902) |
| 17 | Salima | TA Khombedza | 34.31 | -13.59 | 1118 | (896-1814) |
| 18 | Lilongwe | TA Kalumba | 33.79 | -14.09 | 1022 | (787-1321) |
| 19 | Mulanje | TA Nkanda | 35.46 | -15.95 | 1118 | (887-1392) |
| 20 | Chikwawa | TA Ngabu | 34.93 | -16.53 | 1046 | (718-1652) |
| 21 | Mchinji | TA Mlonyeni | 32.96 | -13.87 | 997 | (866-1277) |
| 22 | Machinga | TA Mlomba | 35.49 | -15.09 | 991 | (858-1267) |
| 23 | Nsanje | TA Ngabu | 35.15 | -16.97 | 980 | (744-1323) |
| 24 | Lilongwe | TA Masumbankhunda | 33.58 | -14.13 | 994 | (848-1302) |
| 25 | Phalombe | TA Nazombe | 35.80 | -15.69 | 967 | (811-1247) |
Candidate Locations (90 Minutes)
| ID | District | TA | Long. | Lat. | PLHIV | 95% CI |
|---|---|---|---|---|---|---|
| 1 | Chikwawa | TA Makhwira | 35.03 | -16.22 | 1869 | (1248-2578) |
| 2 | Balaka | TA Kalembo | 35.18 | -14.75 | 1328 | (876-1908) |
| 3 | Salima | TA Khombedza | 34.36 | -13.56 | 1192 | (793-1793) |
| 4 | Ntcheu | TA Goodson Ganya | 34.70 | -14.50 | 1039 | (668-1509) |
| 5 | Nsanje | TA Ngabu | 35.16 | -16.98 | 994 | (654-1377) |
| 6 | Mangochi | TA Nankumba | 34.95 | -14.20 | 1001 | (678-1522) |
| 7 | Phalombe | TA Jenala | 35.66 | -15.52 | 944 | (513-1323) |
| 8 | Chikwawa | TA Katunga | 34.72 | -16.13 | 939 | (602-1331) |
| 9 | Machinga | STA Nsanama | 35.35 | -15.06 | 909 | (663-1258) |
| 10 | Chikwawa | TA Ngabu | 34.71 | -16.37 | 912 | (568-1336) |
| 11 | Nsanje | TA Tengani | 35.28 | -16.78 | 908 | (502-1314) |
| 12 | Machinga | STA Nchinguza | 35.83 | -14.96 | 889 | (714-1154) |
| 13 | Mangochi | TA Makanjila | 35.12 | -13.90 | 904 | (523-1536) |
| 14 | Kasungu | TA Santhe | 33.24 | -13.45 | 791 | (557-1191) |
| 15 | Kasungu | TA Chilowamatambe | 33.55 | -13.16 | 782 | (595-1203) |
| 16 | Mangochi | TA Mponda | 35.01 | -14.43 | 768 | (588-1017) |
| 17 | Chikwawa | TA Ngabu | 34.91 | -16.56 | 704 | (467-1040) |
| 18 | Nsanje | TA Ngabu | 35.27 | -16.98 | 696 | (515-932) |
| 19 | Machinga | STA Nchinguza | 35.87 | -14.97 | 694 | (435-1395) |
| 20 | Karonga | TA Kyungu | 34.06 | -10.18 | 653 | (511-919) |
| 21 | Mangochi | STA Chiunda | 35.42 | -14.70 | 638 | (417-832) |
| 22 | Mangochi | TA Nankumba | 35.03 | -14.34 | 673 | (479-1160) |
| 23 | Zomba | TA Mkumbira | 35.84 | -15.42 | 647 | (442-1024) |
| 24 | Zomba | TA Mkumbira | 35.61 | -15.32 | 638 | (443-952) |
| 25 | Machinga | TA Chikweo | 35.68 | -14.88 | 631 | (507-872) |
Summary Information
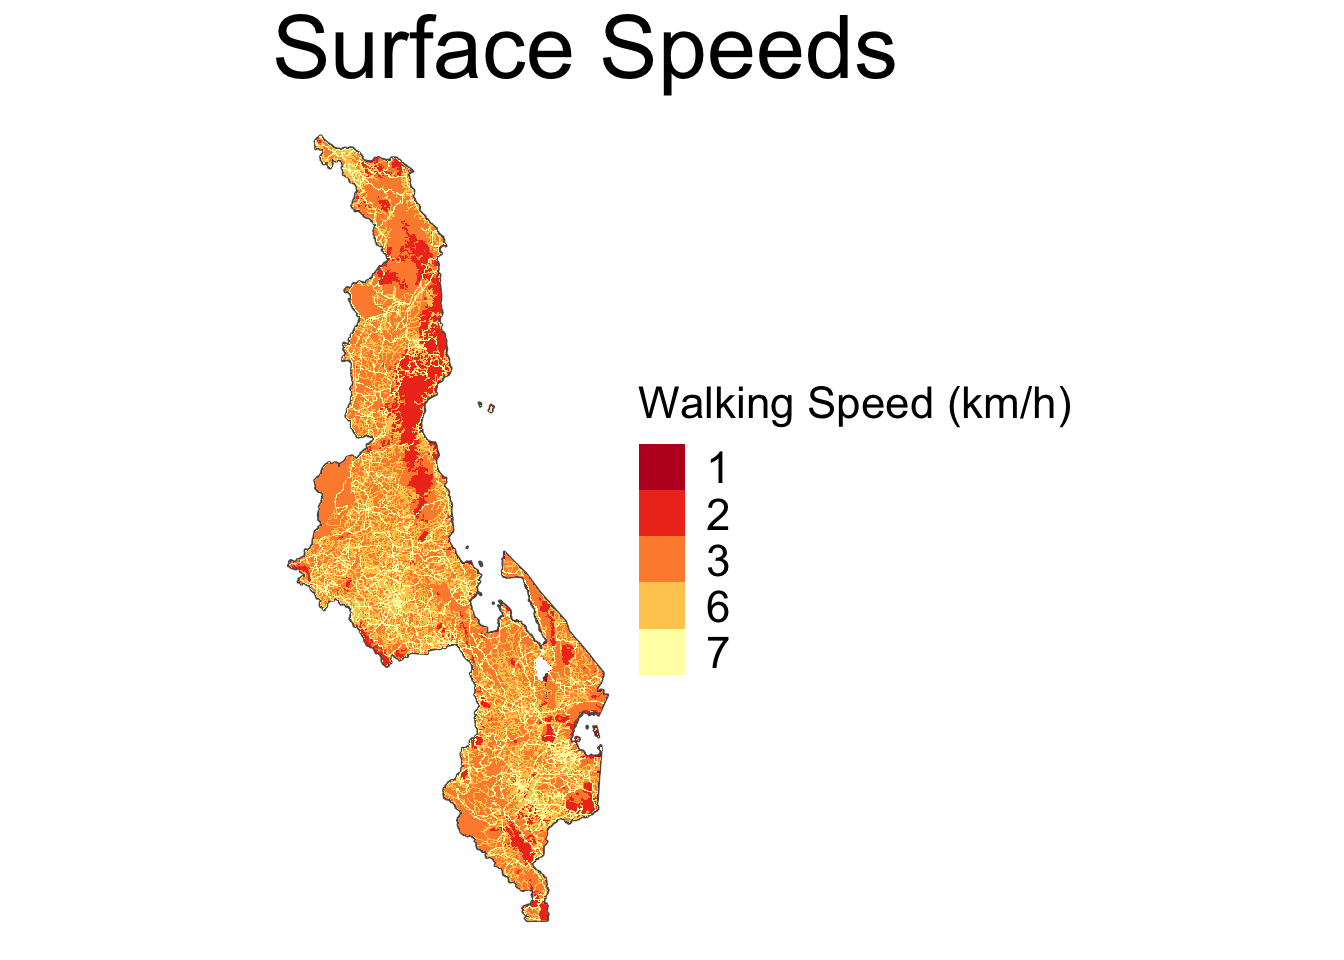
Surface speed assumptions
The friction surface map below illustrates the speed assumptions we used to produce the travel time surfaces.
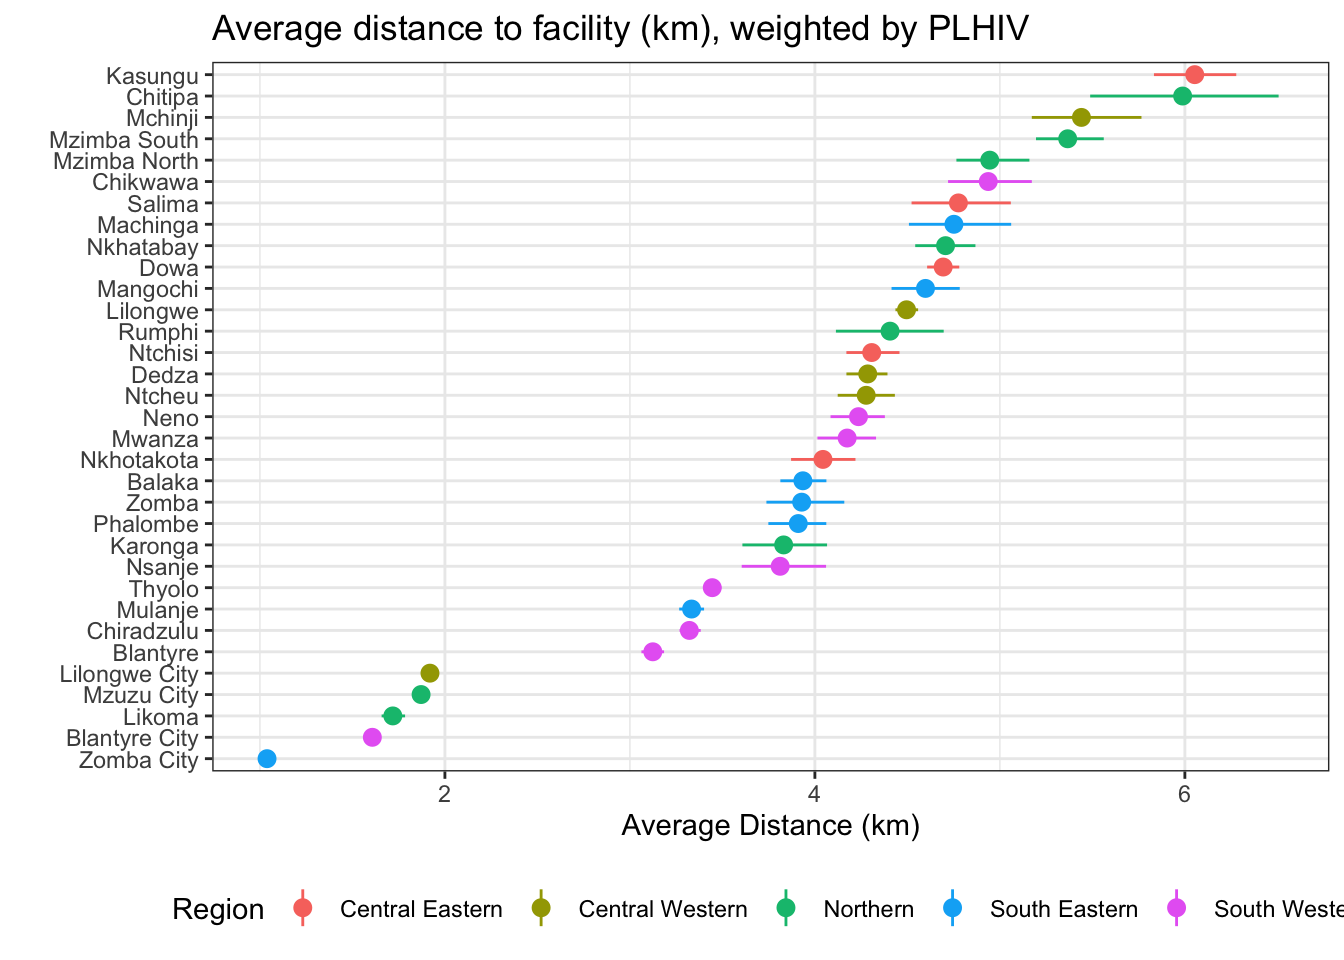
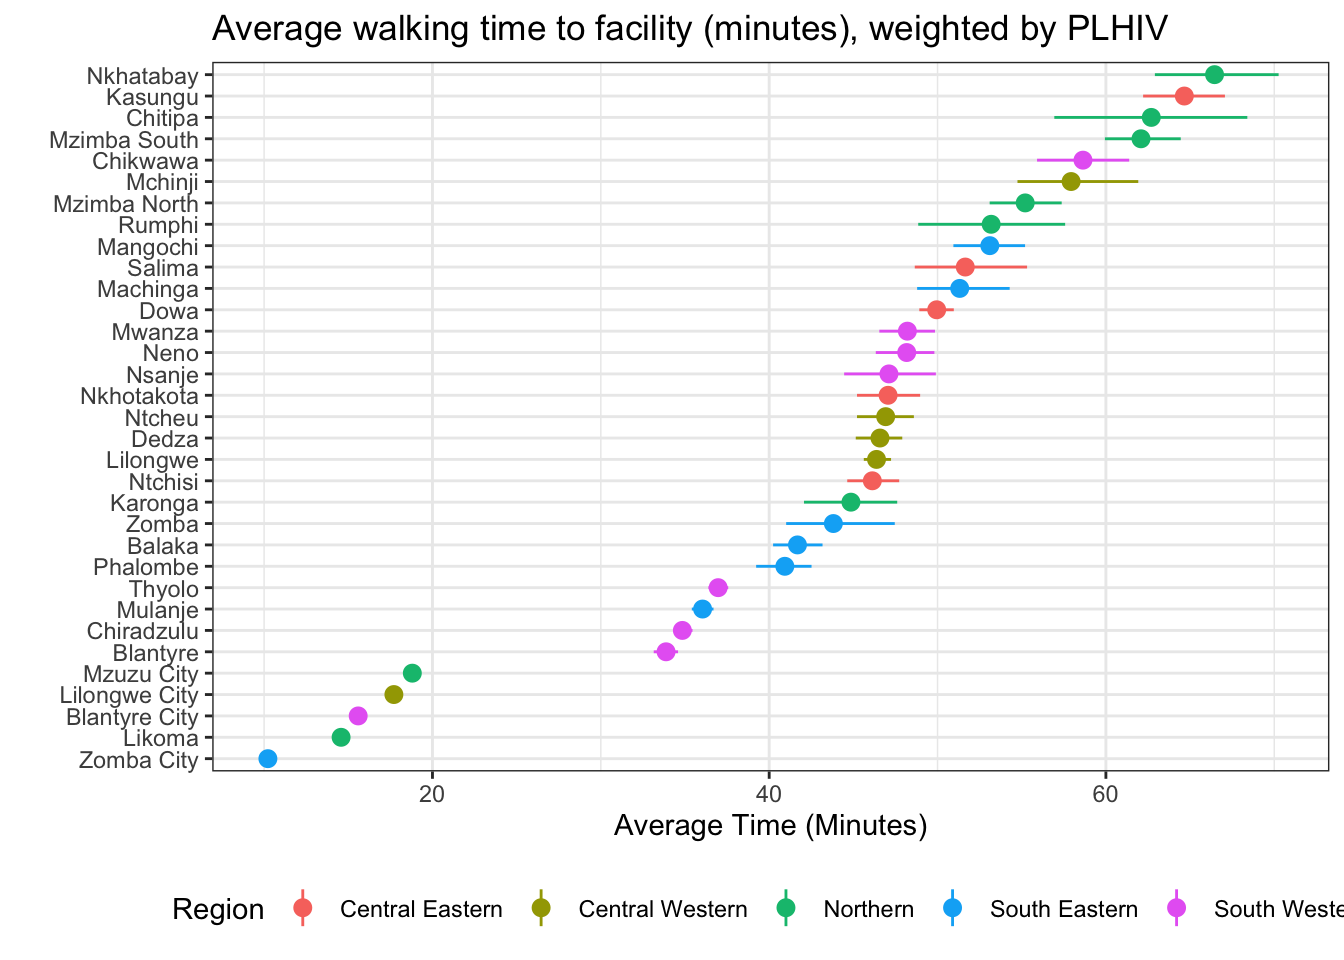
Average distance/time to facility
Provided below are summary charts on the average distance/travel time to the nearest facility, stratified at the district level.
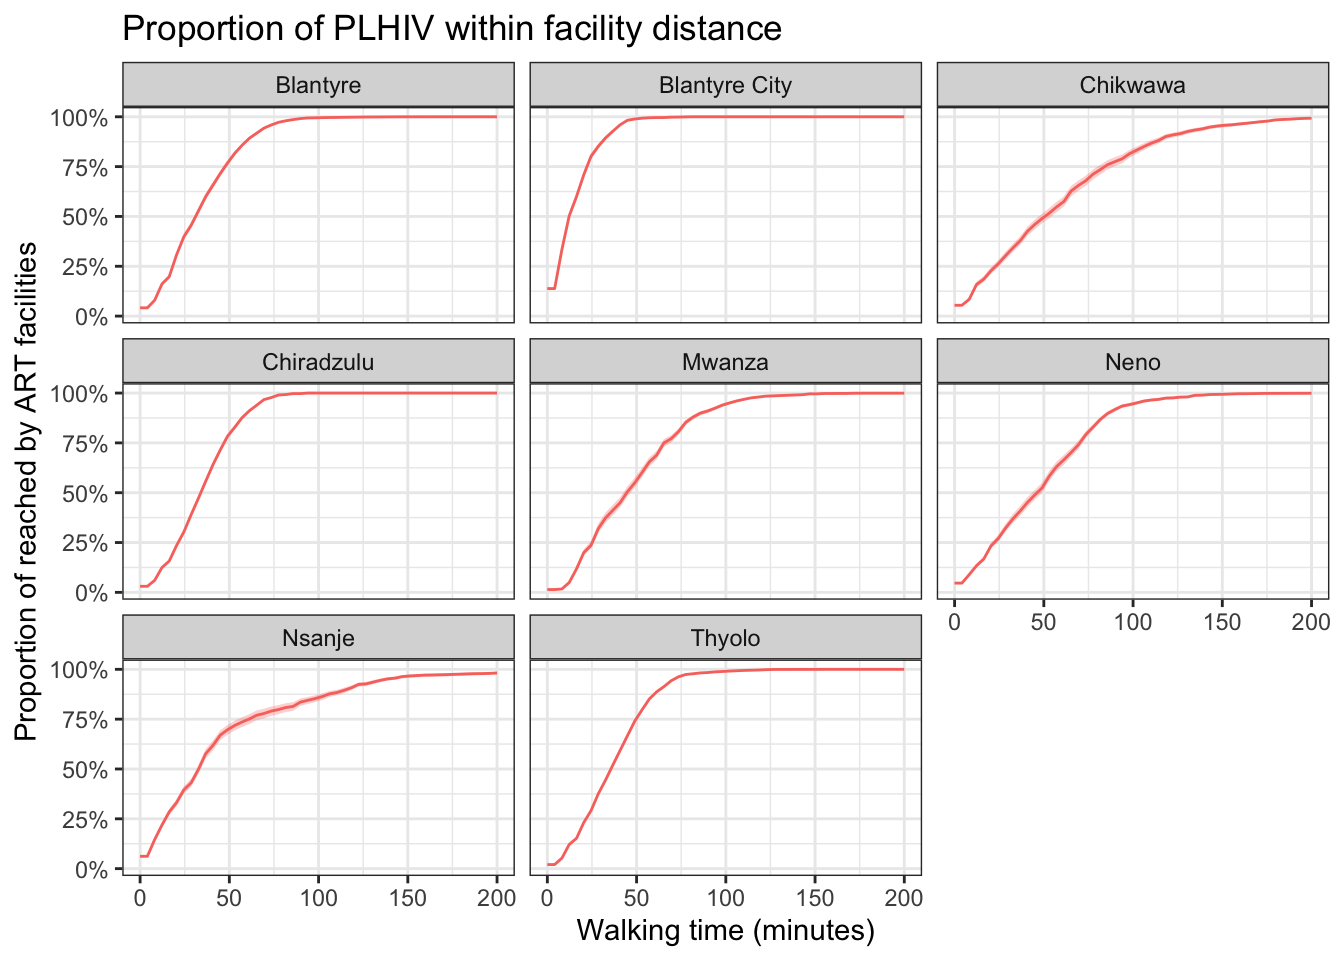
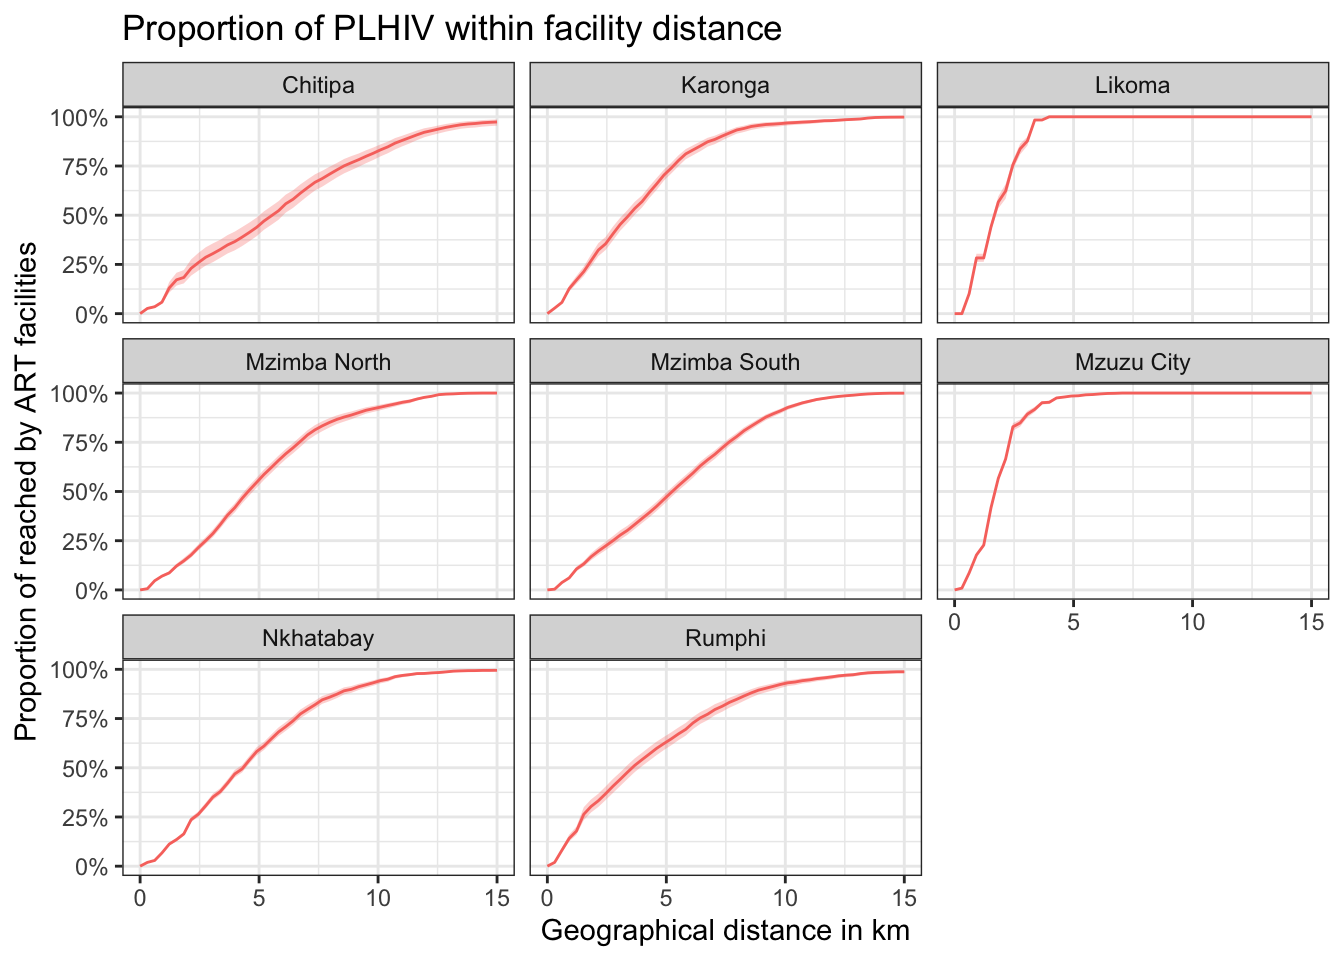
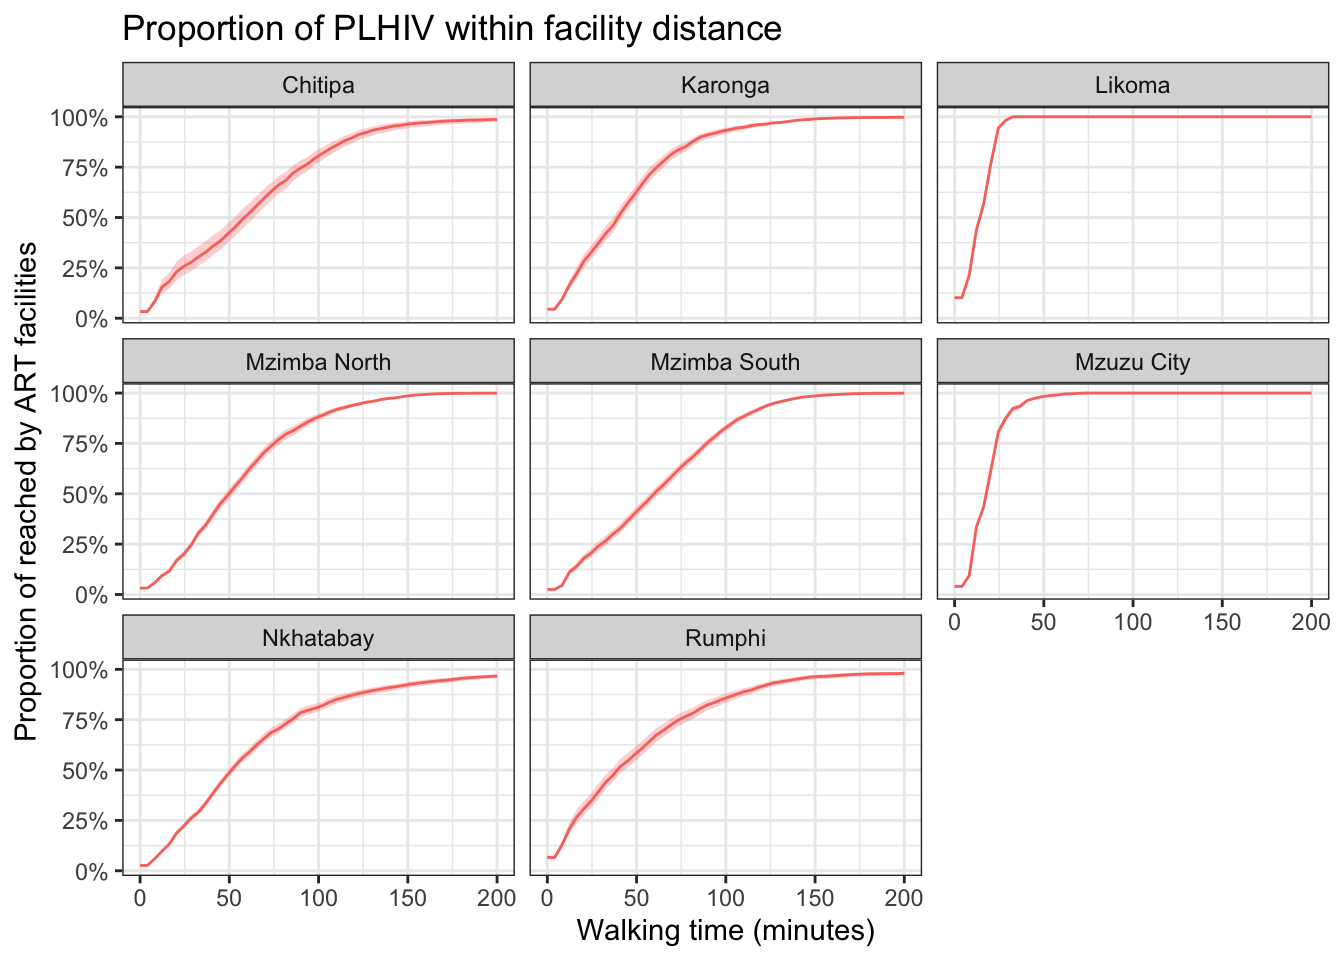
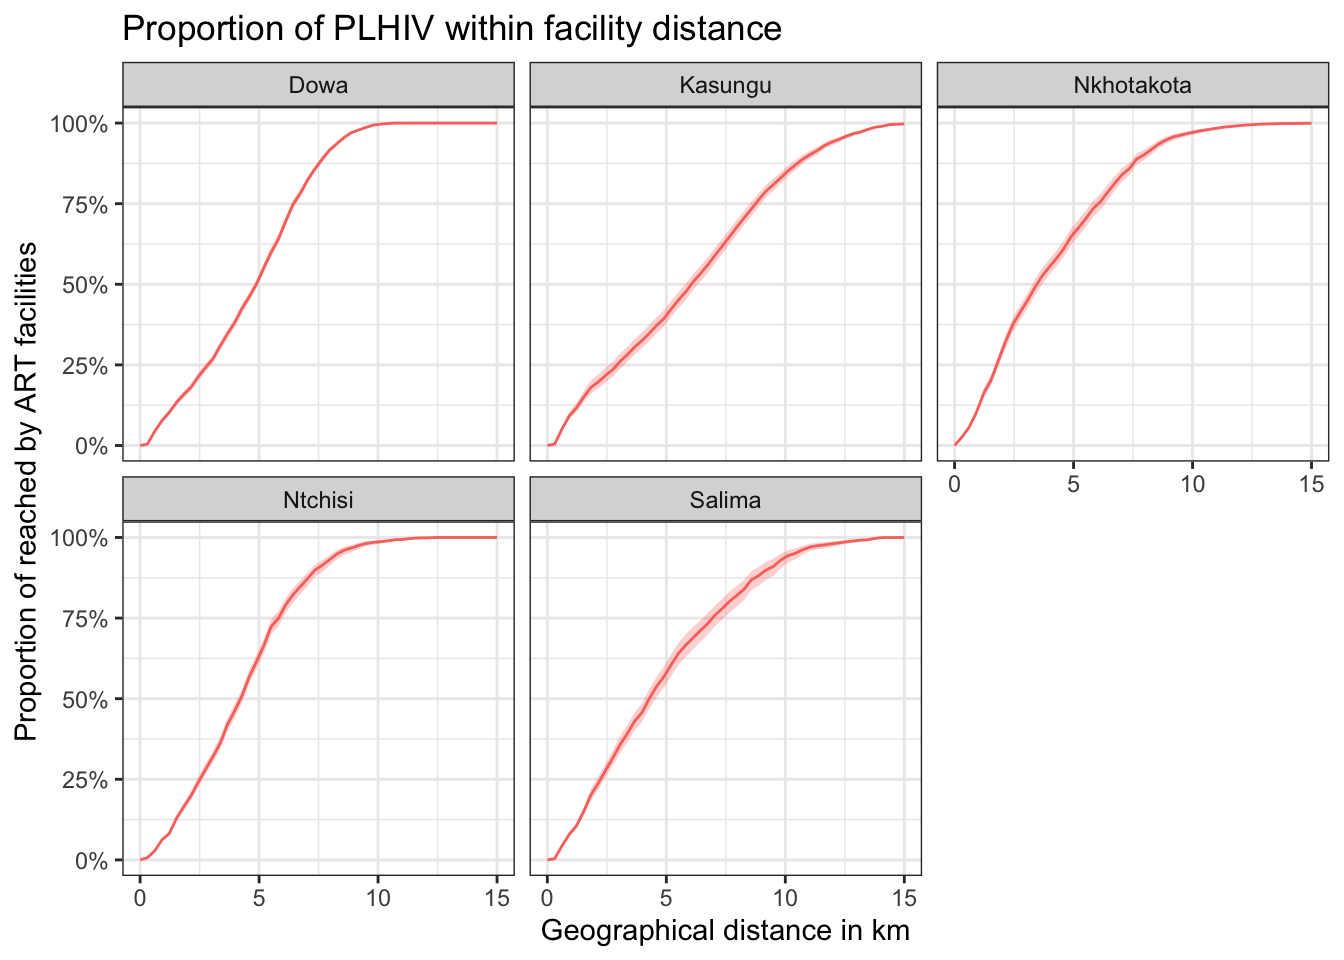
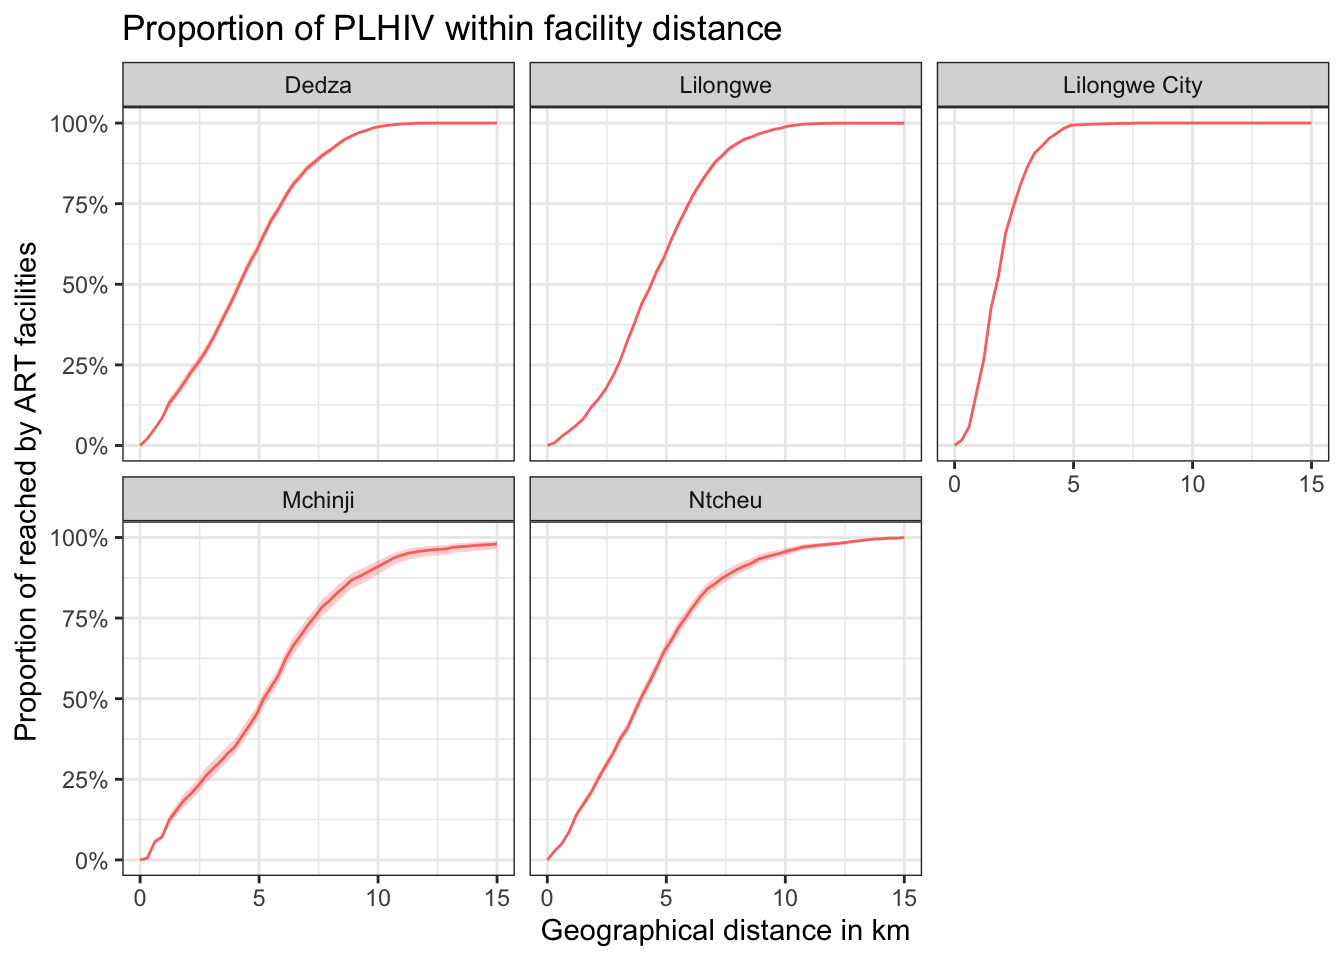
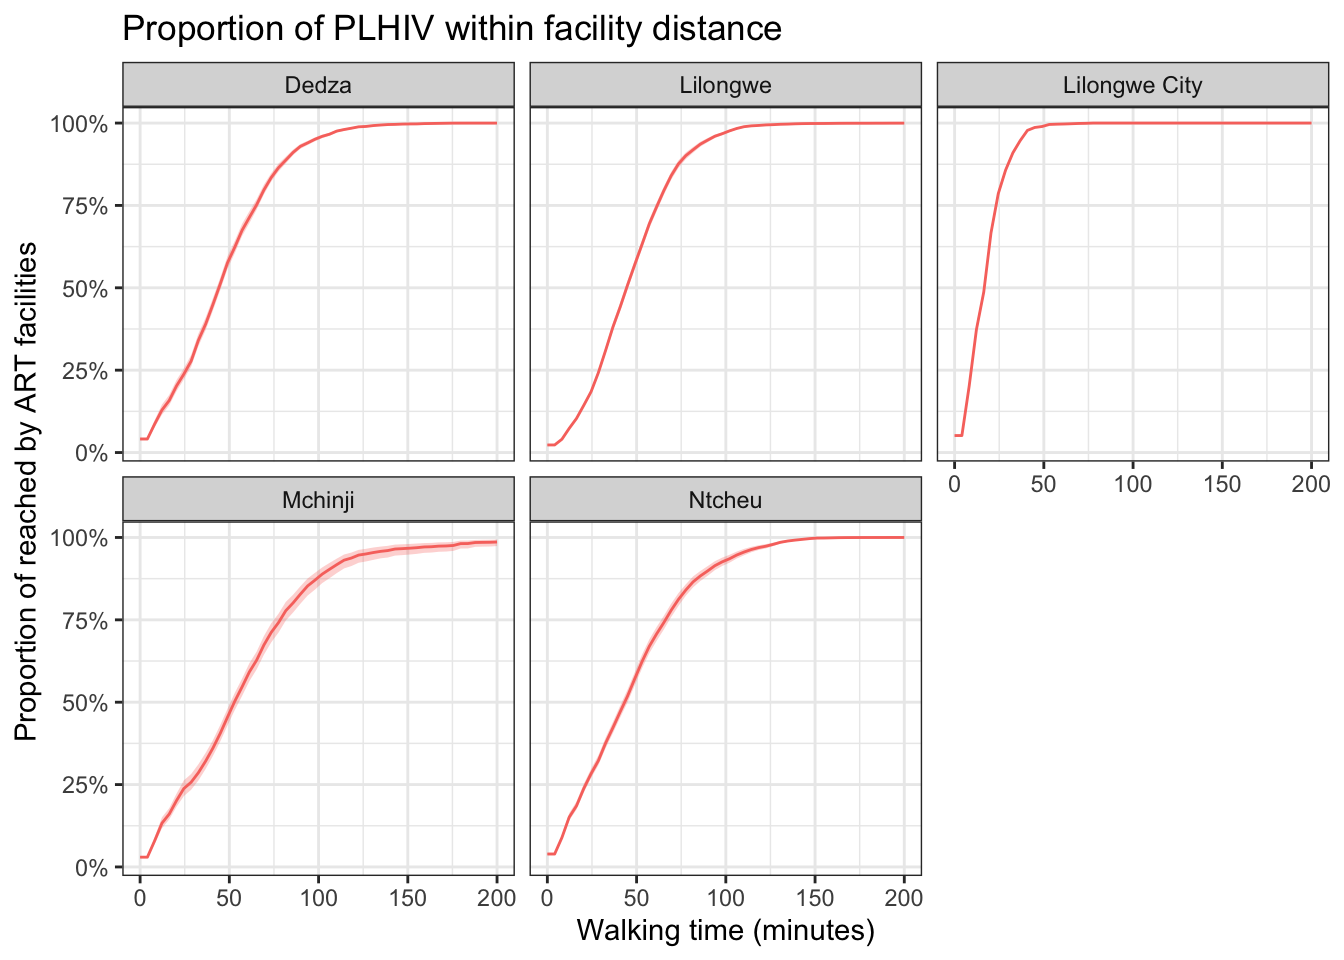
Proportion of district-level PLHIV within reach (over thresholds)
The proportion of PLHIV that are within reach (in terms of travel time and distance) is illustrated below. The distance/travel time is on the x-axis, and the proportion of PLHIV that can reach their nearest facility at the given distance/travel time is displayed on the y-axis.
Note: In districts neighbouring water bodies (e.g. Likoma, Nkhata Bay), the proportion of PLHIV within reach may be be underestimated, as some pixels in our analysis lie “on water”. This will be fixed as a next step.
Northern
Geographical Distance
Travel Time
Central Eastern
Geographical Distance
Travel Time

Central Western
Geographical Distance
Travel Time
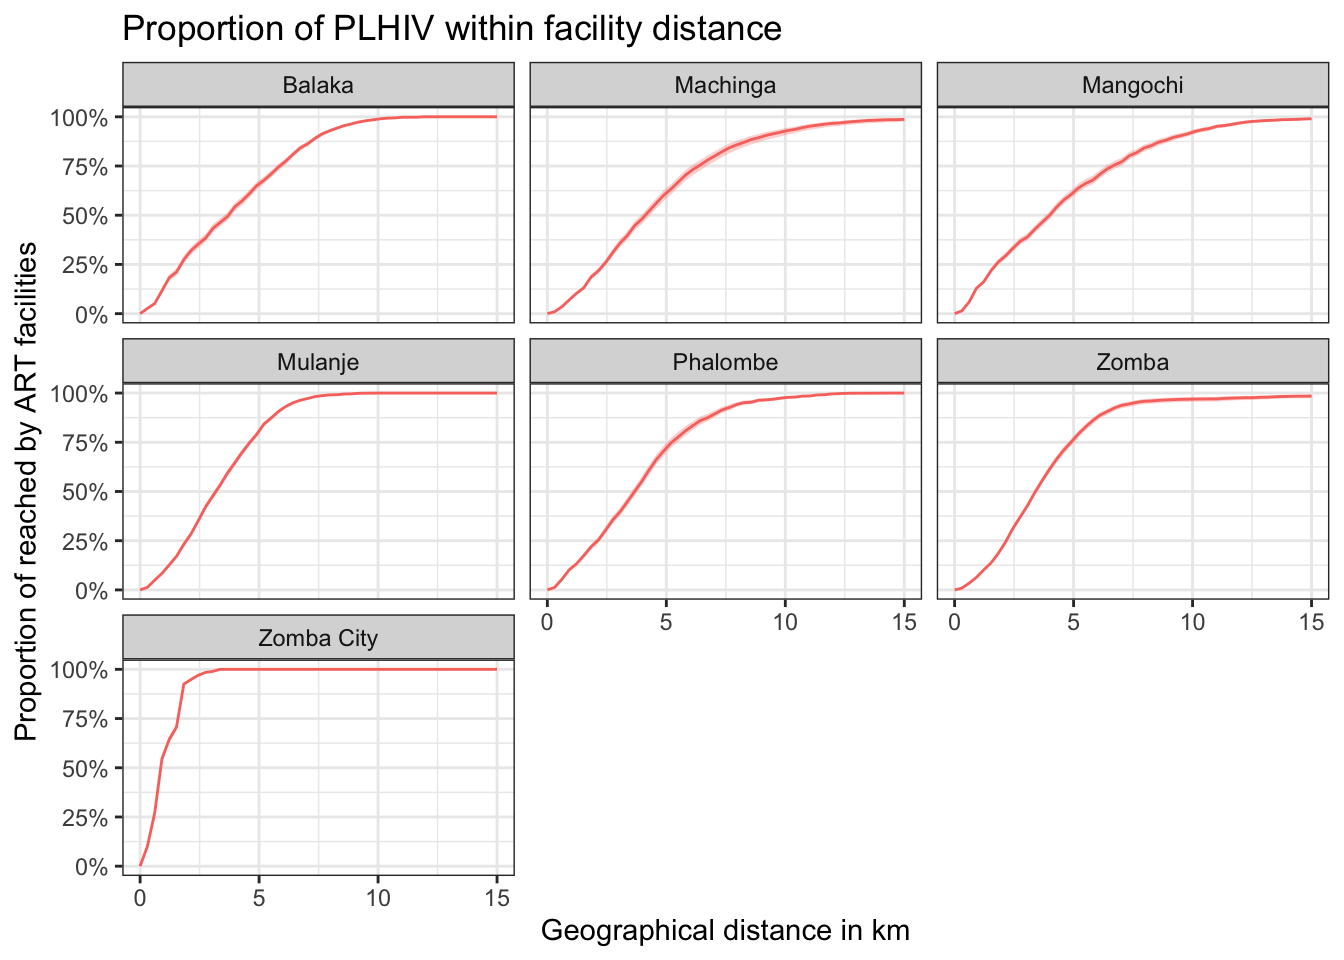
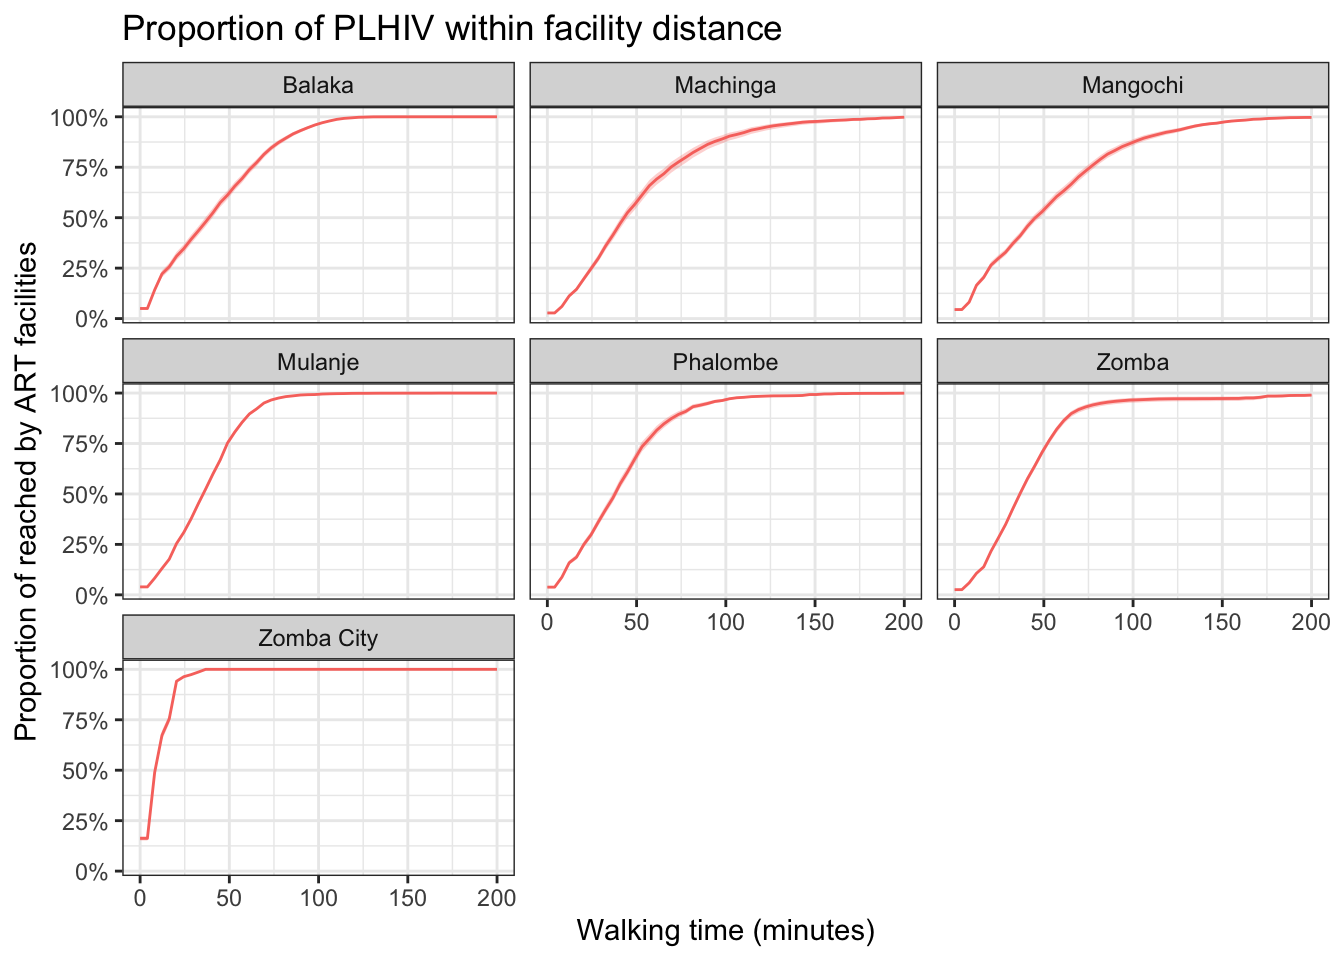
South Eastern
Geographical Distance
Travel Time
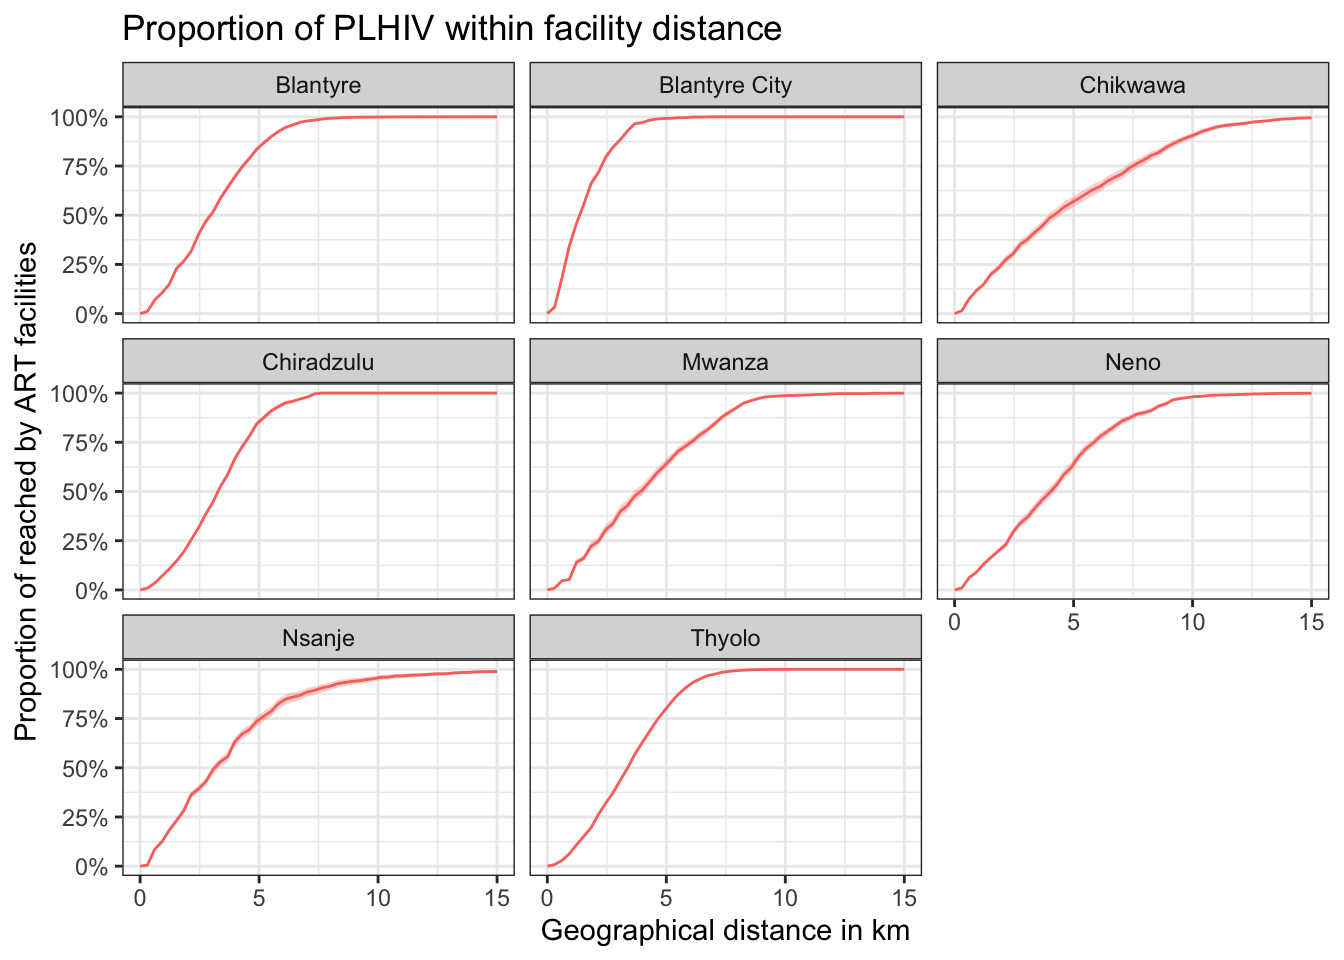
South Western
Geographical Distance
Travel Time