Distances and travel times to ART facilities for PLHIV
March 2022
Overview (Salima)
The goals of this analysis are:
- For given travel times (60, 90, 120 minutes) or geographical distances (5, 8, 10 km), estimate the proportion and number of PLHIV that can reach their closest ART facility. This is done on a district and traditional authority (TA) level.
- Produce a gridded PLHIV prevalence map of Malawi using the WorldPop population density map and Naomi PLHIV estimates that supports the identification of locations that may be underserved.
- Incorporate travel time maps that indicate the time and distance needed to reach the closest ART facilities, based on a combination of digital elevation and land cover maps as well as road layouts in Malawi.
- Identify and propose new candidate facilities and locations for ART treatment scaling-up activities.
For the detailed methodology on how these maps were created, please refer to the supplementary material provided.
Download the full district report here.
Salima Maps
Population, PLHIV and Travel Times
Malawi Overview Map
Each pixel on the map corresponds to an area of 1km x 1km. Below we display a map of Malawi with some general information:
- Population: population density using the WorldPop population density map, adjusted to the 2018 census numbers.
- PLHIV: gridded prevalence estimates of the number of people living with HIV (“PLHIV density estimates”).
- HIV Prevalence: estimated gridded HIV prevalence.
- Geographical distance: direct distance (in km) to the closest ART facility.
- Walking time: estimated travel time (in minutes) to the closest ART facility at a given pixel.
Additionally, it is possible to add markers with facility locations to the map:
- ART Facilities: health facilities that provide ART services and had at least one patient on ART in 2020 (based on the DHA-MIS database).
- “Private for profit” facilities are excluded from the analysis.
- The number of ART patients in Q3/2020 is provided in the brackets.
- Non-ART Facilities (Static): other (nonprofit) health facilities that do not currently provide ART facilities. (These include facilities that have indicated that they have capacity to provide ART services).
Time Thresholds
By comining the travel time maps with the gridded PLHIV prevalence, the number of PLHIV that is not reached within a certain time limit or distance (km) is computed. This is visualised in the below two maps, stratified by geographical distance and walking time.
Example interpretations:
- Walking 15 minutes: this gives a map of the regions with PLHIV for which the closest facility is more than 15 mintues (walking time) away.
- 5km distance: this gives a map of the regions with PLHIV for which the closest facility is more than 5km (geographical distance) away.
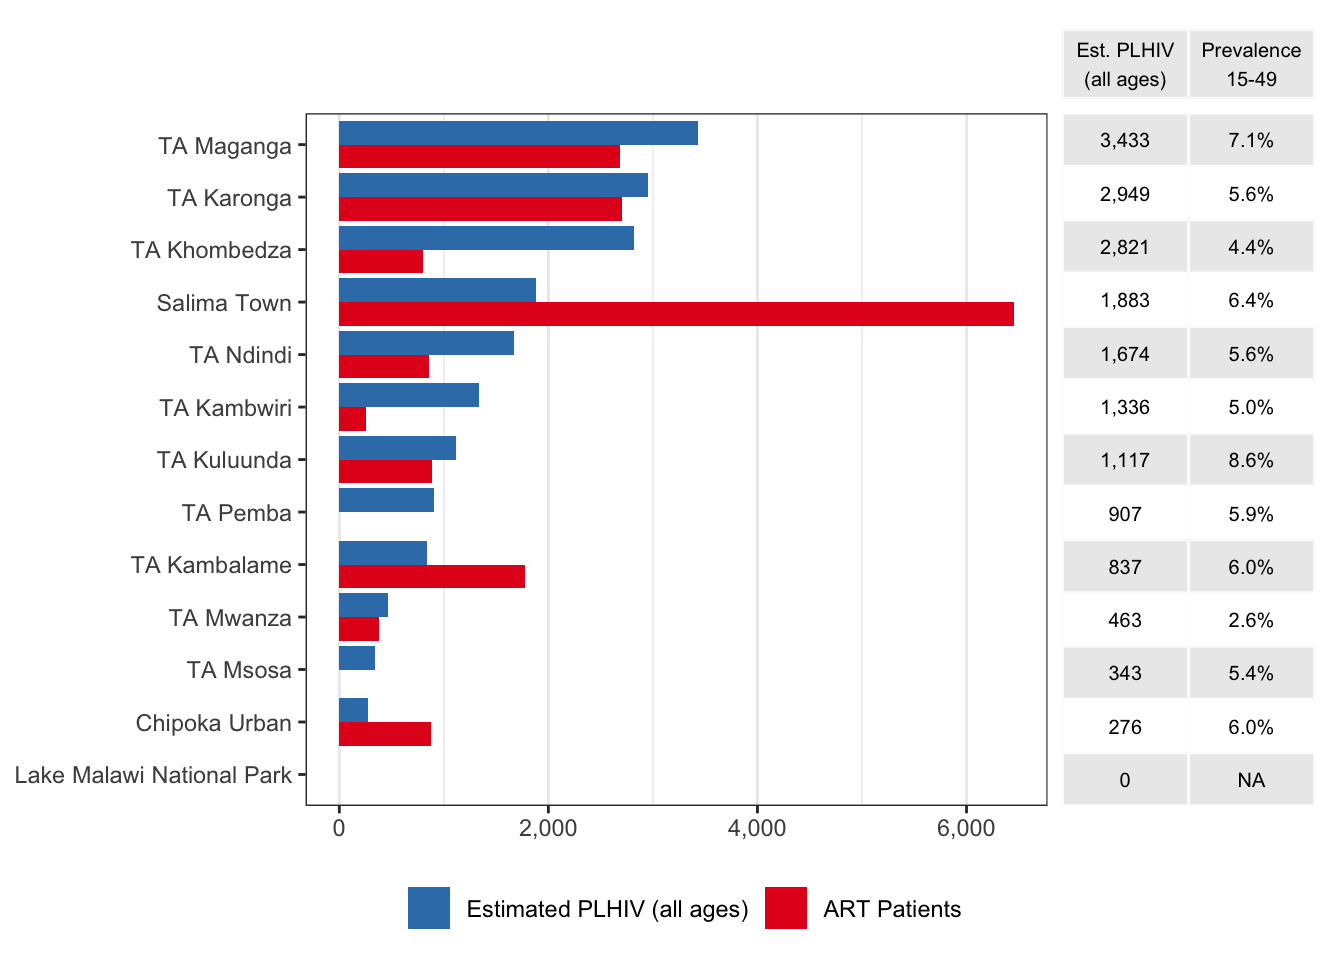
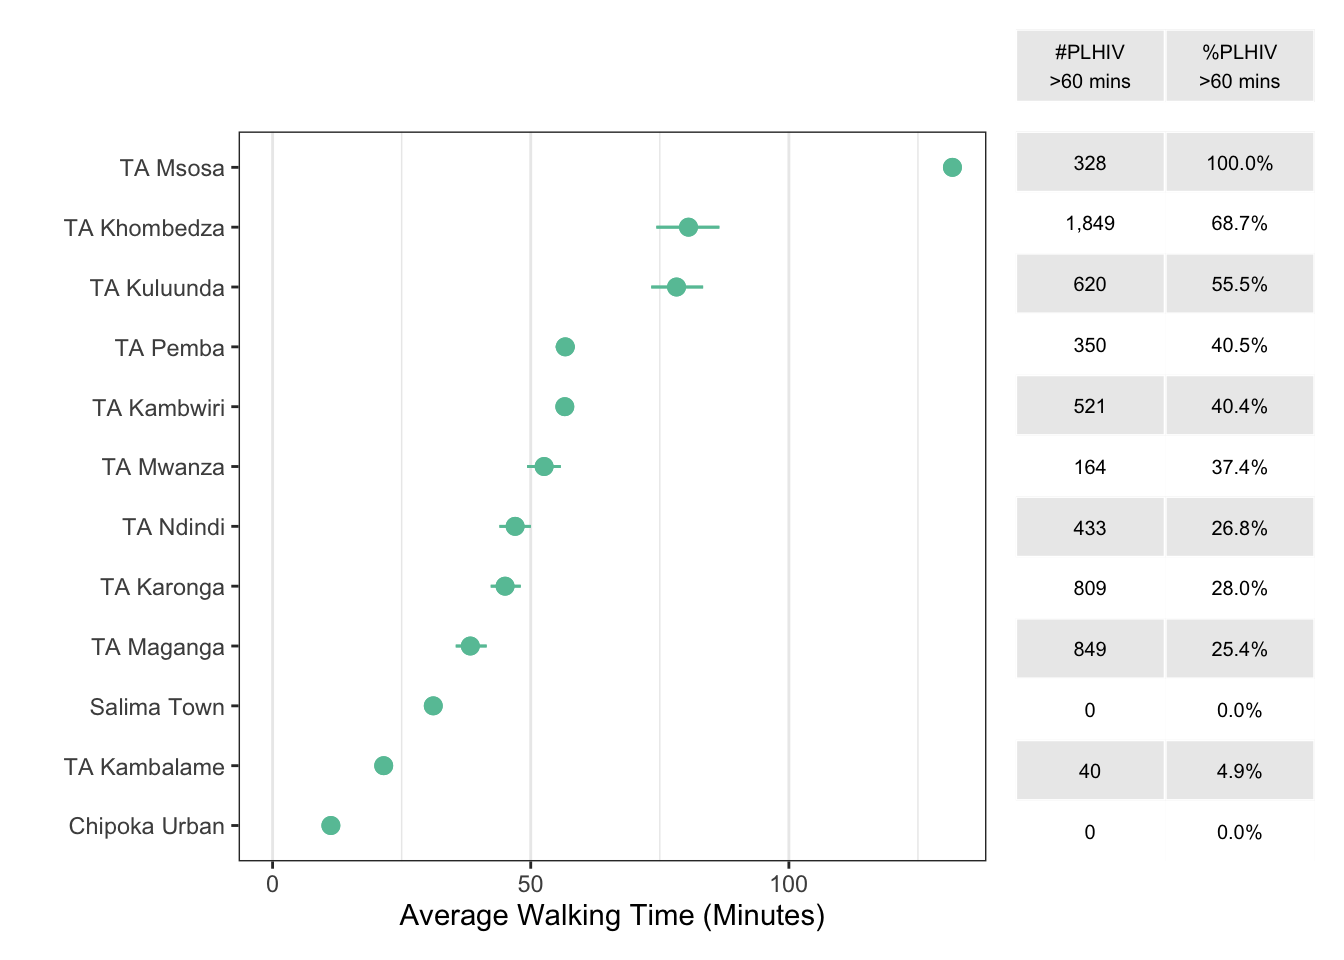
TA analysis
To support the analysis, we have computed the proportion and number of PLHIV that are not reached within a given time or distance. Higher percentages correspond to a larger proportion of PLHIV that is not reached within the relevant area.
Candidate Facilities (60 Minutes)
Below we provide proposed facilities for scaling-up activities, illustrated on the maps. Green areas indicate additional PLHIV that can be reached through the proposed facilities within 60 minutes. Note: facility labels were aligned to district reports that were disseminated.
Summary Information
| Total PLHIV (all ages) | 18,040 (15,114–21,274) |
| HIV prevalence, age 15-49 years | 5.6% (4.7%–6.6%) |
| Total patients receiving ART | 22,401 |
| Average walking time to nearest ART (minutes) | 52 (49–55) |
| Number PLHIV > 60 minutes walking time | 5,963 (4,851–7,328) |
| Percentage PLHIV > 60 minutes walking time | 34.0% (30.8%–37.7%) |
Facility List
ART Facilities
| ID | District | TA | Name | Type | Authority | Long. | Lat. | ART |
|---|---|---|---|---|---|---|---|---|
| A1 | Salima | Salima Town | Salima District Hosp. | District hospital | Government | 34.42 | -13.76 | 6455 |
| A2 | Salima | TA Karonga | Khombedza HC | Health centre | Government | 34.38 | -13.76 | 1491 |
| A3 | Salima | TA Kambalame | Life Line Salima HC | Health centre | NGO | 34.54 | -14.09 | 1392 |
| A4 | Salima | TA Maganga | Senga Bay Baptist Medical Clinic | District hospital | CHAM | 34.60 | -13.74 | 1070 |
| A5 | Salima | TA Kuluunda | Lifuwu HC | Health centre | Government | 34.59 | -13.68 | 886 |
| A6 | Salima | Chipoka Urban | Chipoka HC | Health centre | Government | 34.52 | -13.99 | 873 |
| A7 | Salima | TA Ndindi | Mchoka HC | Health centre | Government | 34.49 | -13.93 | 862 |
| A8 | Salima | TA Maganga | Mafco HC | Health centre | Other | 34.60 | -13.78 | 810 |
| A9 | Salima | TA Maganga | Maganga HC | Health centre | Government | 34.56 | -13.85 | 806 |
| A10 | Salima | TA Khombedza | Thavite HC | Health centre | CHAM | 34.26 | -13.50 | 583 |
| A11 | Salima | TA Mwanza | Makiyoni HC | Health centre | Government | 34.20 | -13.59 | 377 |
| A12 | Salima | TA Karonga | Chinguluwe HC Salima | Health centre | Government | 34.38 | -13.66 | 368 |
| A13 | Salima | TA Karonga | Kaphatenga HC | Health centre | CHAM | 34.38 | -13.76 | 309 |
| A14 | Salima | TA Kambalame | Ngodzi HC | Health centre | Government | 34.51 | -14.09 | 284 |
| A15 | Salima | TA Karonga | Katawa HC | Health centre | Government | 34.32 | -13.71 | 270 |
| A16 | Salima | TA Kambwiri | Chagunda HC | Health centre | Government | 34.37 | -13.88 | 252 |
| A17 | Salima | TA Khombedza | Chitala HC | Health centre | CHAM | 34.27 | -13.67 | 215 |
| A18 | Salima | TA Kambalame | Parachute Battalion Clinic | Dispensary | Other | 34.54 | -14.09 | 101 |
| A19* | Nkhotakota | TA Mwadzama | Alinafe Community Hosp. | Rural/Community | CHAM | 34.24 | -13.39 | 897 |
| A20* | Nkhotakota | TA Mwadzama | Mwansambo HC | Health centre | Government | 34.13 | -13.50 | 334 |
| A21* | Nkhotakota | TA Mwadzama | Benga HC | Health centre | Government | 34.27 | -13.37 | 158 |
| A22* | Nkhotakota | TA Mwadzama | Mtosa HC | Health centre | Government | 34.27 | -13.44 | 151 |
| A23* | Ntchisi | TA Chikho | Mzandu HC | Health centre | Government | 34.03 | -13.49 | 130 |
| A24* | Dowa | TA Chiwere | Mvera Army Camp | Special | Other | 34.14 | -13.78 | 481 |
| A25* | Dowa | TA Chiwere | Mvera Mission Hosp. | Health centre | CHAM | 34.13 | -13.74 | 403 |
| A26* | Dowa | TA Chiwere | Thonje HC | Health centre | Government | 34.24 | -13.72 | 288 |
| A27* | Dowa | TA Chiwere | Nalunga Mafika HC | Health centre | Government | 34.06 | -13.64 | 98 |
| A28* | Lilongwe | STA Chitekwele | Chimbalanga HC | Health centre | Government | 34.12 | -13.94 | 166 |
| A29* | Dedza | TA Tambala | Kaphuka HC | Health centre | Government | 34.31 | -14.04 | 794 |
| A30* | Dedza | TA Kachindamoto | Mtakataka HC | Health centre | Government | 34.51 | -14.23 | 700 |
| A31* | Dedza | TA Kachindamoto | Nakalazi HC | Health centre | CHAM | 34.55 | -14.20 | 302 |
| A32* | Dedza | TA Kachindamoto | Police College HC Mua | Health centre | Other | 34.51 | -14.23 | 95 |
Non-ART Facilities
| ID | District | TA | Name | Type | Authority | Long. | Lat. | PLHIV | 95% CI |
|---|---|---|---|---|---|---|---|---|---|
| F1 | Salima | Salima Town | Ndimoyo Palliative Trust Clini | Clinic | NGO | 34.46 | -13.78 | 764 | (551-1013) |
| F2 | Salima | Salima Town | BLM Salima | Special | NGO | 34.44 | -13.77 | 345 | (255-452) |
| F3 | Salima | Salima Town | Salima Aids Support Org | Special | NGO | 34.44 | -13.77 | 377 | (275-495) |
| F4 | Salima | Salima Town | Salima Admarc Disp. | Dispensary | Company | 34.46 | -13.79 | 764 | (551-1013) |
| F5* | Dowa | TA Msakambewa | MATEKENYA | Dispensary | Government | 34.05 | -13.56 | 177 | (121-251) |
| F6* | Dowa | TA Chiwere | Nalunga HC | Health Centre | Government | 34.06 | -13.64 | 0 | (0-0) |
| F7* | Dowa | TA Mkukula | St. Mary’s Rehabilitation Heal | Health Centre | CHAM | 34.04 | -13.73 | 227 | (151-322) |
| F8* | Dedza | TA Tambala | Kalulu HC | Health Centre | Government | 34.20 | -14.00 | 136 | (87-200) |
| F9* | Dedza | TA Tambala | MPOMBE | Health Post | Government | 34.31 | -13.99 | 126 | (83-184) |
| F10* | Dedza | TA Tambala | KANYERERE | Health Post | Government | 34.23 | -13.97 | 91 | (55-137) |
| F11* | Dedza | TA Kachindamoto | Mtakataka Police College HC | Health Centre | Other | 34.51 | -14.23 | 0 | (0-0) |
| F12* | Dedza | TA Kachindamoto | Ntakataka Police Disp. | Health Centre | Government | 34.51 | -14.23 | 0 | (0-0) |