Distances and travel times to ART facilities for PLHIV
March 2022
Overview (Chitipa)
The goals of this analysis are:
- For given travel times (60, 90, 120 minutes) or geographical distances (5, 8, 10 km), estimate the proportion and number of PLHIV that can reach their closest ART facility. This is done on a district and traditional authority (TA) level.
- Produce a gridded PLHIV prevalence map of Malawi using the WorldPop population density map and Naomi PLHIV estimates that supports the identification of locations that may be underserved.
- Incorporate travel time maps that indicate the time and distance needed to reach the closest ART facilities, based on a combination of digital elevation and land cover maps as well as road layouts in Malawi.
- Identify and propose new candidate facilities and locations for ART treatment scaling-up activities.
For the detailed methodology on how these maps were created, please refer to the supplementary material provided.
Download the full district report here.
Chitipa Maps
Population, PLHIV and Travel Times
Malawi Overview Map
Each pixel on the map corresponds to an area of 1km x 1km. Below we display a map of Malawi with some general information:
- Population: population density using the WorldPop population density map, adjusted to the 2018 census numbers.
- PLHIV: gridded prevalence estimates of the number of people living with HIV (“PLHIV density estimates”).
- HIV Prevalence: estimated gridded HIV prevalence.
- Geographical distance: direct distance (in km) to the closest ART facility.
- Walking time: estimated travel time (in minutes) to the closest ART facility at a given pixel.
Additionally, it is possible to add markers with facility locations to the map:
- ART Facilities: health facilities that provide ART services and had at least one patient on ART in 2020 (based on the DHA-MIS database).
- “Private for profit” facilities are excluded from the analysis.
- The number of ART patients in Q3/2020 is provided in the brackets.
- Non-ART Facilities (Static): other (nonprofit) health facilities that do not currently provide ART facilities. (These include facilities that have indicated that they have capacity to provide ART services).
Time Thresholds
By comining the travel time maps with the gridded PLHIV prevalence, the number of PLHIV that is not reached within a certain time limit or distance (km) is computed. This is visualised in the below two maps, stratified by geographical distance and walking time.
Example interpretations:
- Walking 15 minutes: this gives a map of the regions with PLHIV for which the closest facility is more than 15 mintues (walking time) away.
- 5km distance: this gives a map of the regions with PLHIV for which the closest facility is more than 5km (geographical distance) away.
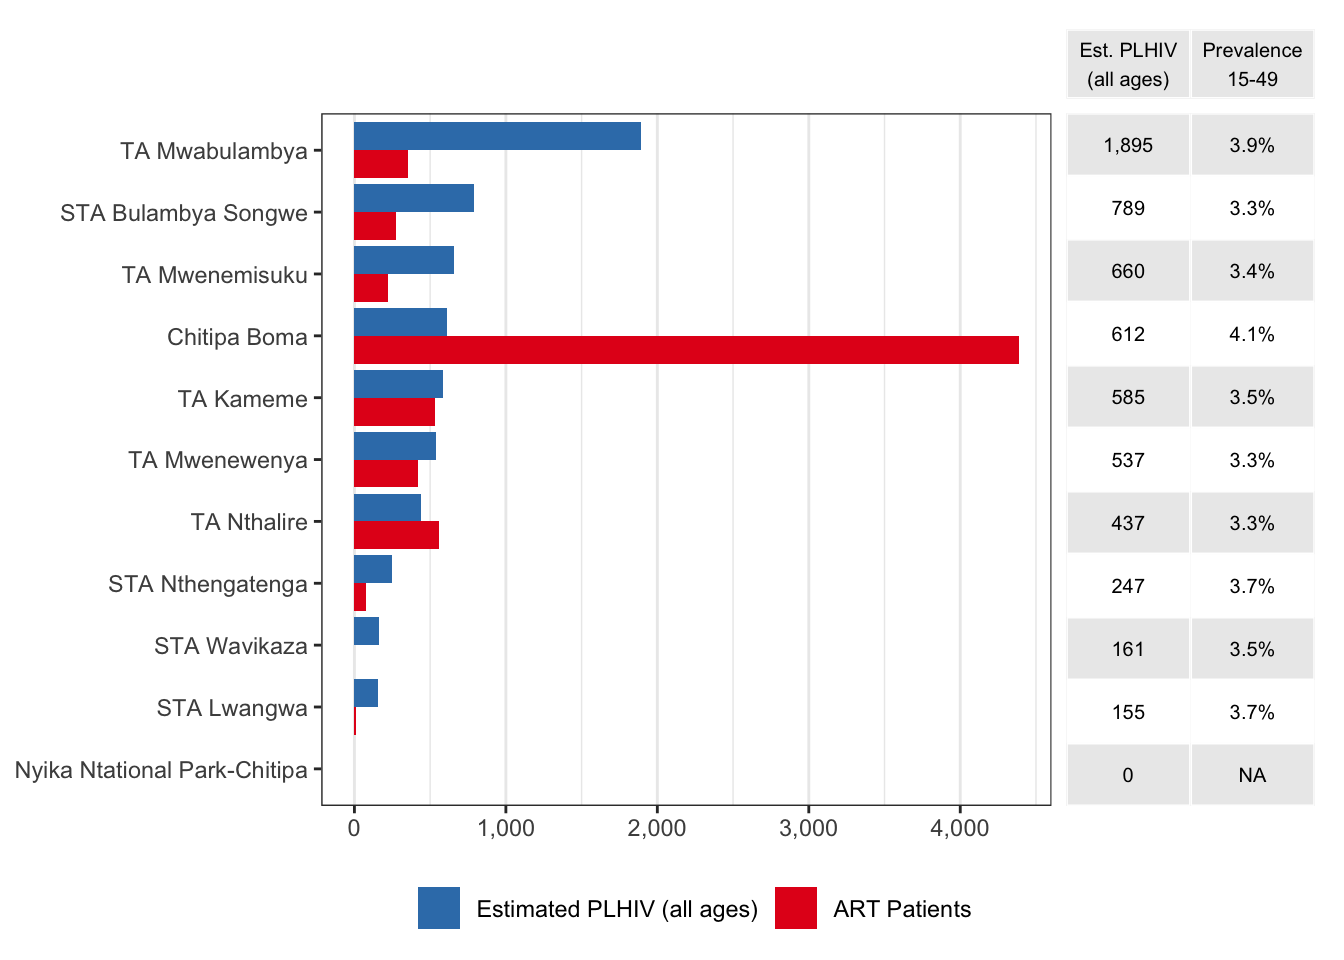
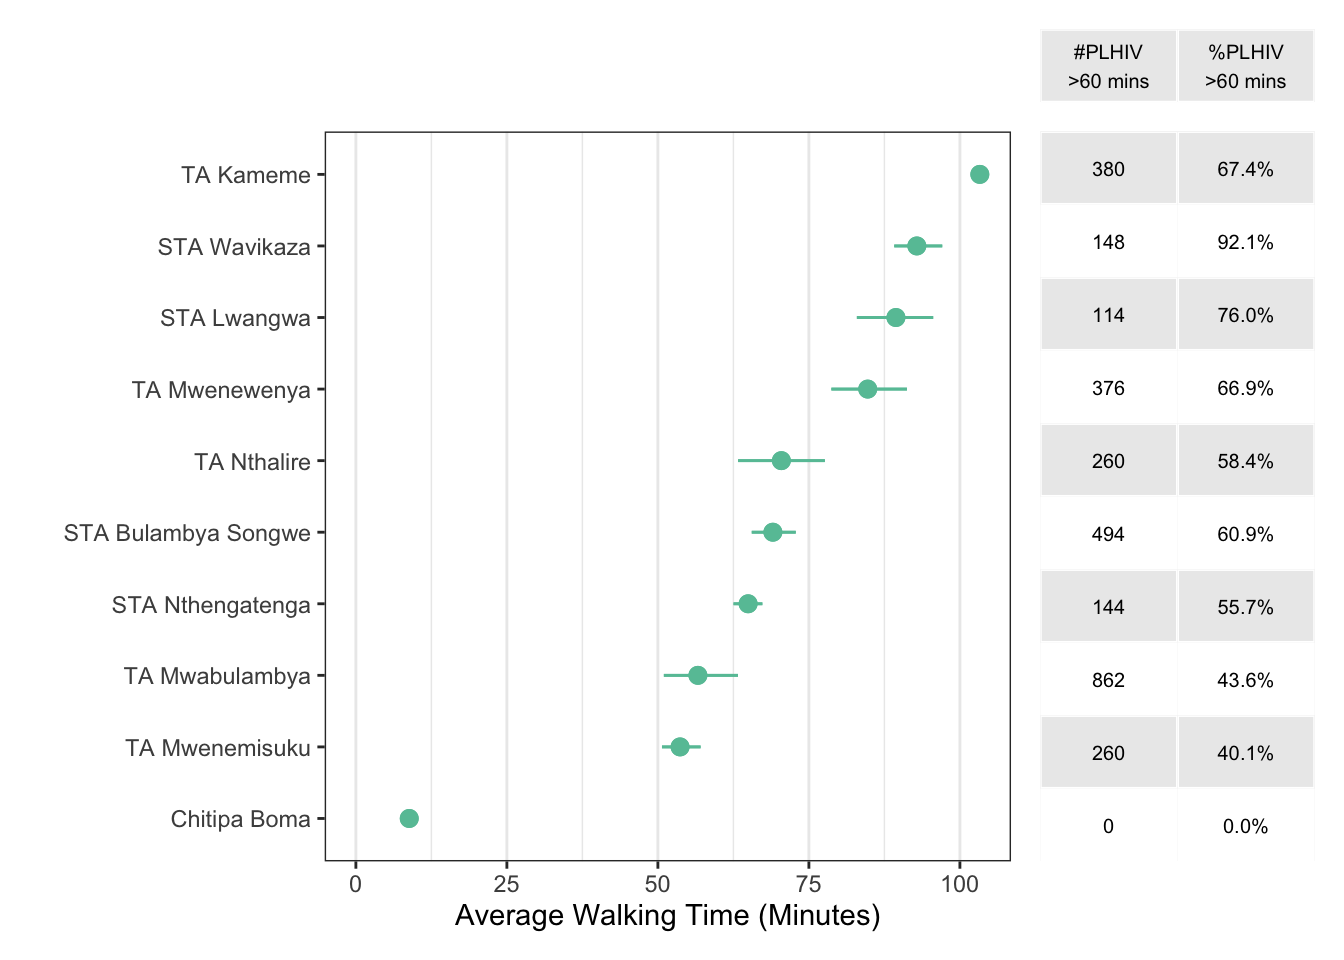
TA analysis
To support the analysis, we have computed the proportion and number of PLHIV that are not reached within a given time or distance. Higher percentages correspond to a larger proportion of PLHIV that is not reached within the relevant area.
Candidate Facilities (60 Minutes)
Below we provide proposed facilities for scaling-up activities, illustrated on the maps. Green areas indicate additional PLHIV that can be reached through the proposed facilities within 60 minutes. Note: facility labels were aligned to district reports that were disseminated.
Summary Information
| Total PLHIV (all ages) | 6,077 (4,706–7,925) |
| HIV prevalence, age 15-49 years | 3.6% (2.8%–4.7%) |
| Total patients receiving ART | 7,035 |
| Average walking time to nearest ART (minutes) | 63 (57–68) |
| Number PLHIV > 60 minutes walking time | 3,038 (2,345–3,787) |
| Percentage PLHIV > 60 minutes walking time | 48.7% (43.7%–53.3%) |
Facility List
ART Facilities
| ID | District | TA | Name | Type | Authority | Long. | Lat. | ART |
|---|---|---|---|---|---|---|---|---|
| A1 | Chitipa | Chitipa Boma | Chitipa District Hosp. | District hospital | Government | 33.27 | -9.70 | 4385 |
| A2 | Chitipa | TA Nthalire | Nthalire HC | Health centre | Government | 33.64 | -10.35 | 556 |
| A3 | Chitipa | TA Kameme | Kameme HC | Health centre | Government | 33.13 | -9.54 | 535 |
| A4 | Chitipa | STA Bulambya Songwe | Kapenda HC | Health centre | Government | 33.25 | -9.49 | 272 |
| A5 | Chitipa | TA Mwabulambya | Kaseye Mission Hosp. | District hospital | CHAM | 33.37 | -9.67 | 252 |
| A6 | Chitipa | TA Mwenewenya | Chambo HC | Health centre | CHAM | 33.40 | -9.94 | 226 |
| A7 | Chitipa | TA Mwenewenya | Wenya HC | Health centre | Government | 33.56 | -10.11 | 193 |
| A8 | Chitipa | TA Mwenemisuku | Misuku HC | Health centre | Government | 33.52 | -9.68 | 183 |
| A9 | Chitipa | TA Mwabulambya | Ifumbo HC | Health centre | Government | 33.40 | -9.60 | 100 |
| A10 | Chitipa | STA Nthengatenga | Mahowe HC | Health centre | Government | 33.69 | -10.18 | 75 |
| A11 | Chitipa | TA Mwenemisuku | Chisasu HP | Health post | Government | 33.45 | -9.73 | 38 |
| A12 | Chitipa | STA Lwangwa | Msumbe HC | Health centre | CHAM | 33.68 | -9.75 | 11 |
| A13* | Karonga | TA Mwakaboko | Ngana HC | Health centre | Government | 33.70 | -9.62 | 122 |
| A14* | Karonga | TA Kyungu | Wiliro HC | Health centre | Government | 33.61 | -9.89 | 87 |
Non-ART Facilities
| ID | District | TA | Name | Type | Authority | Long. | Lat. | PLHIV | 95% CI |
|---|---|---|---|---|---|---|---|---|---|
| F1 | Chitipa | TA Mwabulambya | LUFITA | Health Post | Government | 33.36 | -9.71 | 204 | (135-299) |
| F2 | Chitipa | STA Bulambya Songwe | KALIRA | Health Post | Government | 33.31 | -9.58 | 226 | (132-350) |
| F3 | Chitipa | TA Nthalire | KAVUKUKU | Health Post | Government | 33.57 | -10.28 | 151 | (78-265) |
| F4 | Chitipa | TA Mwenemisuku | Kapoka HP | Health Post | Government | 33.45 | -9.78 | 146 | (79-245) |
| F5 | Chitipa | TA Mwabulambya | NACHIPANGAPANGA | Health Post | Government | 33.38 | -9.87 | 140 | (82-221) |
| F6 | Chitipa | TA Mwenewenya | MLEMBE | Health Post | Government | 33.38 | -10.06 | 91 | (46-166) |
| F7 | Chitipa | STA Wavikaza | Therere HP | Health Post | Government | 33.66 | -10.42 | 75 | (38-131) |
| F8 | Chitipa | TA Mwenemisuku | NACHING’ANDA | Health Post | Government | 33.42 | -9.68 | 98 | (63-144) |
| F9 | Chitipa | STA Bulambya Songwe | NGOYA | Health Post | Government | 33.29 | -9.62 | 210 | (129-316) |
| F10 | Chitipa | TA Mwenemisuku | SOKOLA | Health Post | Government | 33.58 | -9.72 | 61 | (33-97) |
| F11 | Chitipa | STA Lwangwa | ITULO | Health Post | Government | 33.60 | -9.68 | 58 | (33-94) |
| F12 | Chitipa | TA Mwabulambya | CHIWETA | Health Post | Government | 33.25 | -9.65 | 140 | (86-213) |
| F13 | Chitipa | STA Nthengatenga | Karopa HP | Health Post | Government | 33.65 | -10.22 | 62 | (31-104) |
| F14 | Chitipa | STA Nthengatenga | KOPAKOPA | Health Post | Government | 33.70 | -10.14 | 48 | (24-85) |
| F15 | Chitipa | TA Mwenemisuku | CHIPWERA | Health Post | Government | 33.52 | -9.77 | 59 | (33-96) |
| F16 | Chitipa | TA Mwenewenya | MPEMBA | Health Post | Government | 33.52 | -10.13 | 32 | (18-54) |
| F17 | Chitipa | TA Nthalire | MCHINA | Health Post | Government | 33.71 | -10.31 | 28 | (14-49) |
| F18 | Chitipa | TA Mwabulambya | IYELA | Health Post | Government | 33.29 | -9.69 | 95 | (61-140) |
| F19 | Chitipa | TA Mwabulambya | KANYENJERE | Health Post | Government | 33.42 | -9.76 | 161 | (99-245) |
| F20 | Chitipa | TA Mwabulambya | CHENDO | Health Post | Government | 33.41 | -9.88 | 138 | (80-224) |
| F21 | Chitipa | TA Mwenemisuku | IGHUGHU | Health Post | Government | 33.50 | -9.67 | 16 | (10-26) |
| F22 | Chitipa | TA Mwenewenya | Chisenga HP | Health Post | Government | 33.39 | -9.97 | 28 | (16-47) |
| F23 | Chitipa | Chitipa Boma | Banja La Mtsogolo Clinic | Clinic | NGO | 33.27 | -9.70 | 46 | (30-67) |
| F24* | Karonga | TA Kilupula | CHIKUTU | Health Post | Government | 33.73 | -9.77 | 72 | (43-114) |
| F25* | Karonga | TA Mwakaboko | NGISI | Health Post | Government | 33.72 | -9.59 | 63 | (36-102) |
| F26* | Karonga | TA Kyungu | KAYELEKELA | Health Post | Government | 33.69 | -9.97 | 60 | (31-103) |
| F27* | Karonga | TA Wasambo | Wovwe Escom Clinic | Clinic | Company | 34.08 | -10.44 | 2 | (1-3) |
| F28* | Rumphi | Nyika National Park | Chilinda | Health Post | Government | 33.81 | -10.59 | 4 | (2-8) |