Distances and travel times to ART facilities for PLHIV
March 2022
Overview (Machinga)
The goals of this analysis are:
- For given travel times (60, 90, 120 minutes) or geographical distances (5, 8, 10 km), estimate the proportion and number of PLHIV that can reach their closest ART facility. This is done on a district and traditional authority (TA) level.
- Produce a gridded PLHIV prevalence map of Malawi using the WorldPop population density map and Naomi PLHIV estimates that supports the identification of locations that may be underserved.
- Incorporate travel time maps that indicate the time and distance needed to reach the closest ART facilities, based on a combination of digital elevation and land cover maps as well as road layouts in Malawi.
- Identify and propose new candidate facilities and locations for ART treatment scaling-up activities.
For the detailed methodology on how these maps were created, please refer to the supplementary material provided.
Download the full district report here.
Machinga Maps
Population, PLHIV and Travel Times
Malawi Overview Map
Each pixel on the map corresponds to an area of 1km x 1km. Below we display a map of Malawi with some general information:
- Population: population density using the WorldPop population density map, adjusted to the 2018 census numbers.
- PLHIV: gridded prevalence estimates of the number of people living with HIV (“PLHIV density estimates”).
- HIV Prevalence: estimated gridded HIV prevalence.
- Geographical distance: direct distance (in km) to the closest ART facility.
- Walking time: estimated travel time (in minutes) to the closest ART facility at a given pixel.
Additionally, it is possible to add markers with facility locations to the map:
- ART Facilities: health facilities that provide ART services and had at least one patient on ART in 2020 (based on the DHA-MIS database).
- “Private for profit” facilities are excluded from the analysis.
- The number of ART patients in Q3/2020 is provided in the brackets.
- Non-ART Facilities (Static): other (nonprofit) health facilities that do not currently provide ART facilities. (These include facilities that have indicated that they have capacity to provide ART services).
Time Thresholds
By comining the travel time maps with the gridded PLHIV prevalence, the number of PLHIV that is not reached within a certain time limit or distance (km) is computed. This is visualised in the below two maps, stratified by geographical distance and walking time.
Example interpretations:
- Walking 15 minutes: this gives a map of the regions with PLHIV for which the closest facility is more than 15 mintues (walking time) away.
- 5km distance: this gives a map of the regions with PLHIV for which the closest facility is more than 5km (geographical distance) away.
TA analysis
To support the analysis, we have computed the proportion and number of PLHIV that are not reached within a given time or distance. Higher percentages correspond to a larger proportion of PLHIV that is not reached within the relevant area.
Candidate Facilities (60 Minutes)
Below we provide proposed facilities for scaling-up activities, illustrated on the maps. Green areas indicate additional PLHIV that can be reached through the proposed facilities within 60 minutes. Note: facility labels were aligned to district reports that were disseminated.
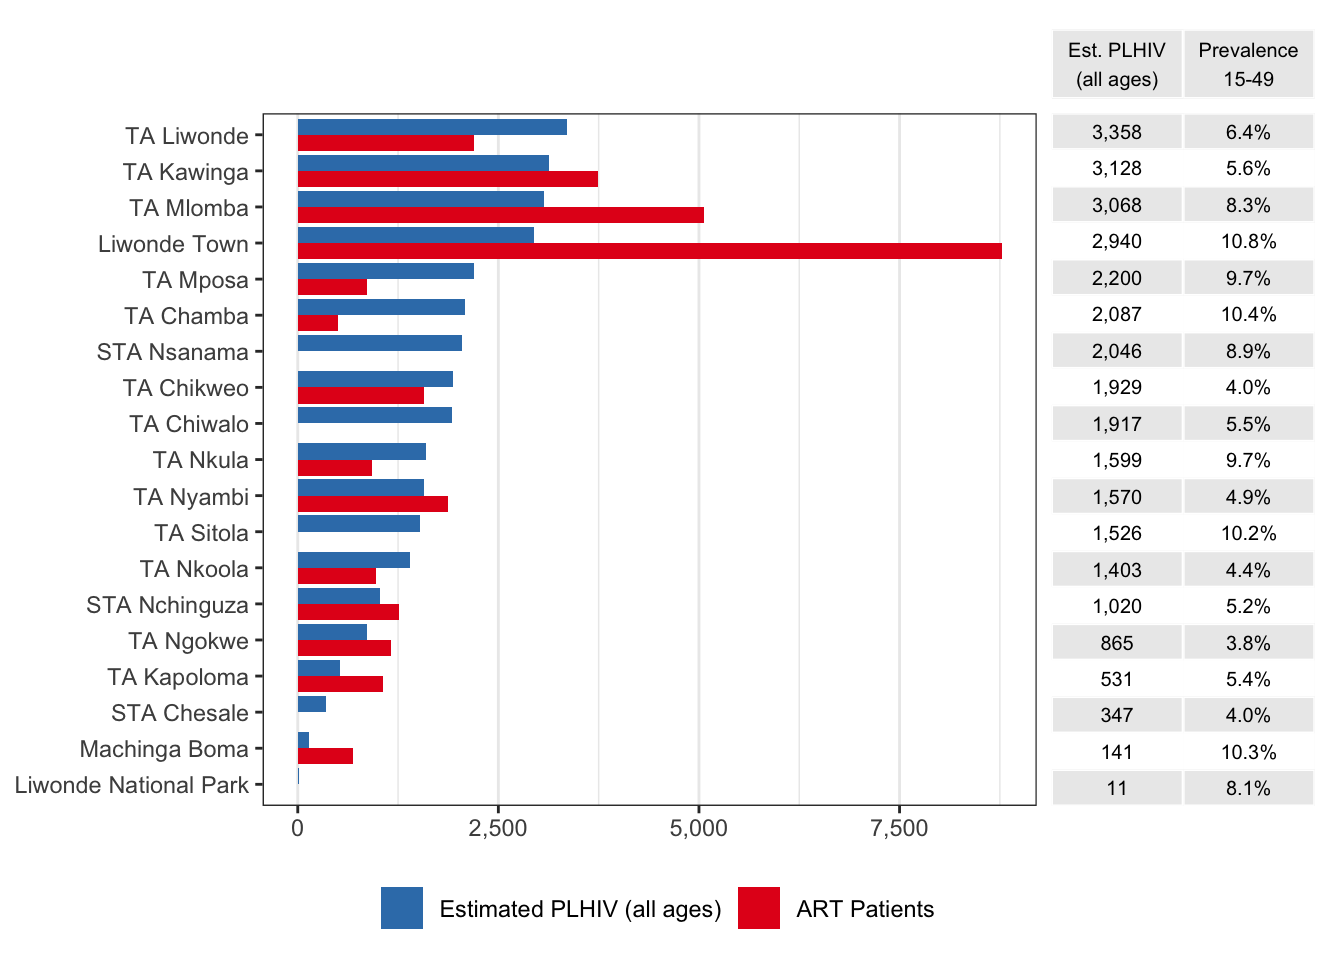
Summary Information
| Total PLHIV (all ages) | 31,683 (27,891–36,303) |
| HIV prevalence, age 15-49 years | 6.6% (5.8%–7.6%) |
| Total patients receiving ART | 54,179 |
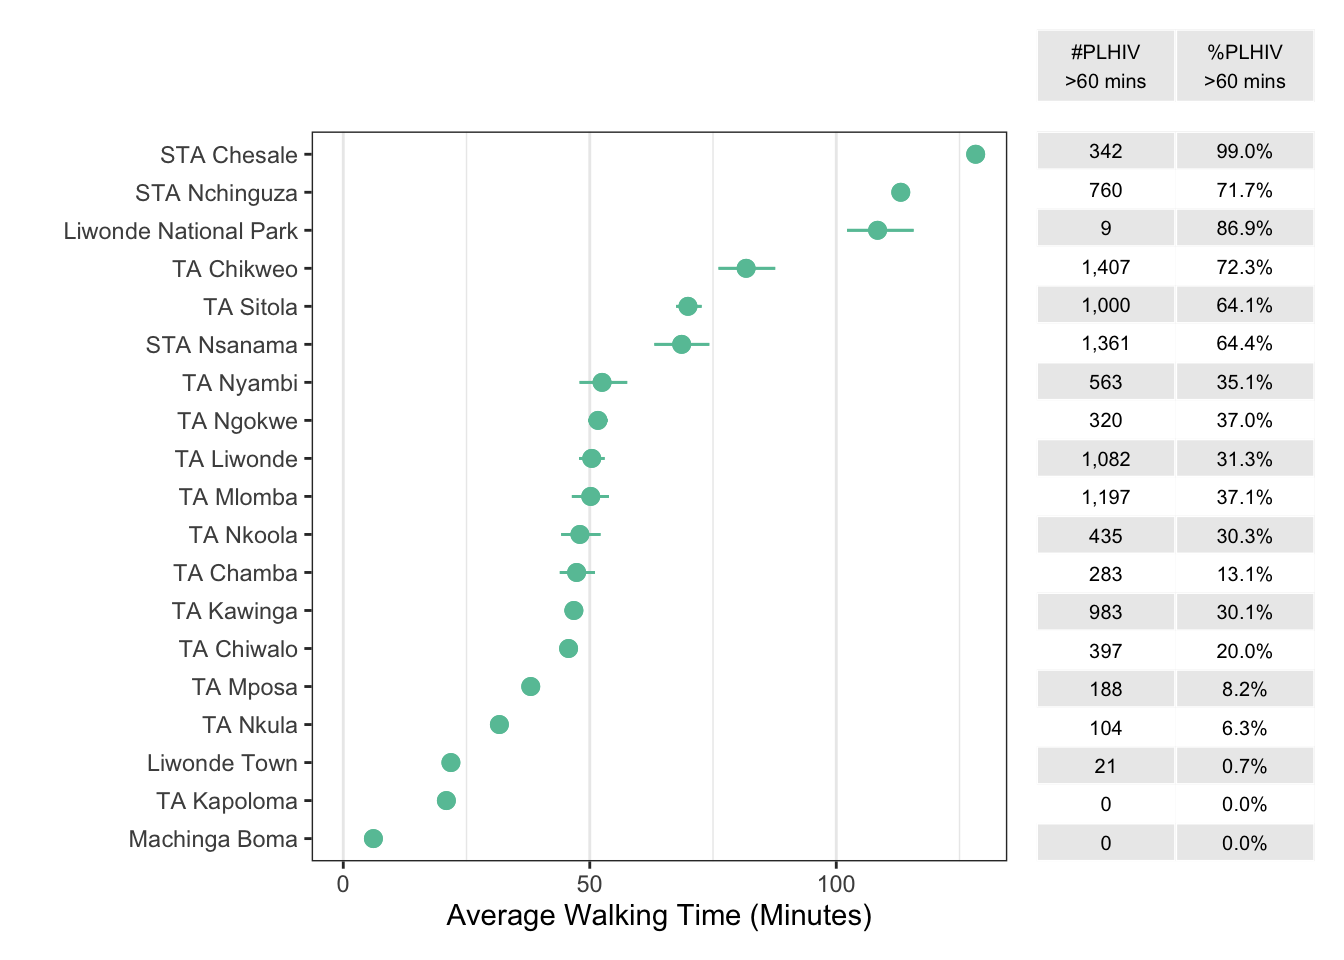
| Average walking time to nearest ART (minutes) | 51 (49–54) |
| Number PLHIV > 60 minutes walking time | 10,452 (8,765–12,323) |
| Percentage PLHIV > 60 minutes walking time | 32.0% (29.3%–34.9%) |
Facility List
ART Facilities
| ID | District | TA | Name | Type | Authority | Long. | Lat. | ART |
|---|---|---|---|---|---|---|---|---|
| A1 | Machinga | Liwonde Town | Machinga District Hosp. | District hospital | Government | 35.23 | -15.06 | 8773 |
| A2 | Machinga | TA Kawinga | Ntaja HC | Health centre | Government | 35.53 | -14.87 | 3450 |
| A3 | Machinga | TA Mlomba | Nsanama HC | Health centre | Government | 35.49 | -14.99 | 1994 |
| A4 | Machinga | TA Chikweo | Chikweo HC | Health centre | Government | 35.67 | -14.76 | 1568 |
| A5 | Machinga | TA Mlomba | Nayuchi HC | Health centre | Government | 35.53 | -14.98 | 1491 |
| A6 | Machinga | STA Nchinguza | Namanja HC | Health centre | Government | 35.68 | -14.96 | 1264 |
| A7 | Machinga | TA Nyambi | Nyambi HC | Health centre | Government | 35.57 | -14.69 | 1222 |
| A8 | Machinga | TA Ngokwe | Ngokwe HC | Health centre | Government | 35.80 | -14.71 | 1161 |
| A9 | Machinga | TA Liwonde | Namandanje HC | Health centre | CHAM | 35.48 | -14.88 | 1070 |
| A10 | Machinga | TA Kapoloma | Nayinunje HC | Health centre | Government | 35.57 | -14.74 | 1062 |
| A11 | Machinga | TA Nkoola | Mpiri HC | Health centre | Government | 35.61 | -14.77 | 976 |
| A12 | Machinga | TA Liwonde | Mangamba HC | Health centre | Government | 35.44 | -14.79 | 928 |
| A13 | Machinga | TA Nkula | Gawanani HC | Health centre | CHAM | 35.20 | -15.22 | 927 |
| A14 | Machinga | TA Mlomba | Ntholowa HC | Health centre | CHAM | 35.57 | -14.99 | 870 |
| A15 | Machinga | TA Mposa | Mposa HC | Health centre | CHAM | 35.52 | -15.15 | 857 |
| A16 | Machinga | TA Mlomba | Mlomba HC | Health centre | Government | 35.48 | -15.02 | 710 |
| A17 | Machinga | Machinga Boma | Machinga HC | Health centre | Government | 35.30 | -15.18 | 689 |
| A18 | Machinga | TA Nyambi | Mkwepere HC | Dispensary | Government | 35.64 | -14.60 | 645 |
| A19 | Machinga | TA Chamba | Chamba Disp. | Dispensary | Government | 35.42 | -15.20 | 501 |
| A20 | Machinga | TA Kawinga | Kayembe HC | Health centre | Government | 35.57 | -14.85 | 289 |
| A21 | Machinga | TA Liwonde | Mbonechera HC | Health centre | Government | 35.48 | -14.89 | 202 |
| A22* | Mangochi | TA Mbwana Nyambi | Mulibwanji Hosp. | Rural/Community | CHAM | 35.59 | -14.51 | 1306 |
| A23* | Mangochi | TA Mbwana Nyambi | Mkumba HC | Health centre | Government | 35.53 | -14.59 | 883 |
| A24* | Mangochi | TA Chowe | Malombe HC | Health centre | Government | 35.35 | -14.63 | 870 |
| A25* | Mangochi | STA Chiunda | Chiunda HC | Dispensary | Government | 35.44 | -14.78 | 778 |
| A26* | Mangochi | TA Mbwana Nyambi | Somba HC | Health centre | Government | 35.54 | -14.65 | 366 |
| A27* | Mangochi | TA Mbwana Nyambi | Sinyala HC | Health centre | Government | 35.58 | -14.58 | 123 |
| A28* | Zomba | TA Malemia | St Lukes Mission Hosp. | District hospital | CHAM | 35.35 | -15.21 | 3715 |
| A29* | Zomba | TA Malemia | Domasi Rural Hosp. | Rural/Community | Government | 35.40 | -15.28 | 2381 |
| A30* | Zomba | TA Kuntumanji | Namasalima HC Zomba | Health centre | Government | 35.49 | -15.23 | 1438 |
| A31* | Zomba | TA Kuntumanji | Bimbi HC | Health centre | Government | 35.48 | -15.31 | 1319 |
| A32* | Zomba | STA Nkapita | Nkasala HC | Health centre | Government | 35.22 | -15.33 | 825 |
| A33* | Zomba | TA Mlumbe | Chilipa HC Zomba | Health centre | CHAM | 35.12 | -15.32 | 665 |
| A34* | Zomba | TA Malemia | Machinjiri HC | Health centre | Government | 35.42 | -15.23 | 560 |
| A35* | Zomba | STA Nkapita | Mmambo HC | Health centre | Government | 35.16 | -15.26 | 551 |
| A36* | Zomba | TA Malemia | H. Parker Sharp HC (Domasi CCAP) | Health centre | CHAM | 35.36 | -15.30 | 237 |
| A37* | Balaka | TA Kalembo | Kalembo HC | Health centre | Government | 35.18 | -14.86 | 1880 |
| A38* | Balaka | TA Kalembo | Namdumbo HC | Health centre | Government | 35.23 | -14.85 | 1050 |
| A39* | Balaka | TA Kalembo | Ulongwe HC | Health centre | CHAM | 35.18 | -14.86 | 992 |
| A40* | Balaka | TA Nkaya | Utale 2 HC | Health centre | Government | 35.07 | -15.17 | 879 |
| A41* | Balaka | TA Amidu | Namanolo HC | Health centre | Government | 35.19 | -15.00 | 809 |
| A42* | Balaka | TA Nkaya | Phimbi HC | Health centre | Government | 35.11 | -15.25 | 807 |
| A43* | Balaka | TA Msamala | Kwitanda HC | Health centre | Government | 35.09 | -15.06 | 683 |
| A44* | Balaka | TA Nkaya | Utale 1 HC | Health centre | CHAM | 35.06 | -15.18 | 413 |
Non-ART Facilities
| ID | District | TA | Name | Type | Authority | Long. | Lat. | PLHIV | 95% CI |
|---|---|---|---|---|---|---|---|---|---|
| F1 | Machinga | STA Nsanama | MOLIPA | Health Post | Government | 35.39 | -15.05 | 851 | (585-1182) |
| F2 | Machinga | TA Chikweo | Chipolonga HP | Health Post | Government | 35.69 | -14.86 | 804 | (524-1151) |
| F3 | Machinga | TA Kawinga | CHAPUSA | Health Post | Government | 35.61 | -14.94 | 448 | (314-613) |
| F4 | Machinga | STA Nchinguza | LIKHONYOWA | Health Post | Government | 35.79 | -14.96 | 447 | (220-815) |
| F5 | Machinga | STA Nsanama | CHISUWI | Health Post | Government | 35.46 | -14.97 | 425 | (293-598) |
| F6 | Machinga | TA Kawinga | CHITUNDU | Health Post | Government | 35.65 | -14.92 | 534 | (347-777) |
| F7 | Machinga | Liwonde Town | Liwonde Health Information | Special | NGO | 35.22 | -15.07 | 104 | (79-137) |
| F8 | Machinga | STA Chesale | CHIMBIRA | Health Post | Government | 35.81 | -14.60 | 97 | (51-165) |
| F9 | Machinga | TA Kawinga | MBANIRA | Health Post | Government | 35.60 | -14.98 | 254 | (181-344) |
| F10 | Machinga | Liwonde Town | BLM Liwonde | Special | NGO | 35.23 | -15.07 | 104 | (79-137) |
| F11* | Mangochi | STA Chiunda | Mbalama Disp. | Dispensary | Government | 35.50 | -14.71 | 527 | (361-748) |
| F12* | Zomba | TA Malemia | Zomba Forestry Disp. | Dispensary | Other | 35.29 | -15.36 | 35 | (27-45) |
| F13* | Zomba | TA Malemia | H Parker Sharp Disp. | Health Centre | CHAM | 35.36 | -15.30 | 0 | (0-0) |
| F14* | Zomba | TA Malemia | Compassionate Mission Clinic | Clinic | NGO | 35.39 | -15.32 | 0 | (0-0) |
| F15* | Balaka | TA Msamala | DZIWE | Health Post | Government | 35.14 | -15.10 | 486 | (348-638) |
| F16* | Balaka | TA Amidu | Mwima HP | Health Centre | Government | 35.19 | -15.00 | 0 | (0-0) |