library(safir)
library(individual)
library(nimue)
#>
#> Attaching package: 'nimue'
#> The following object is masked from 'package:base':
#>
#>     format
library(data.table)
library(ggplot2)
Setup
Here we will set up the model with vaccinations. In this model only a single type of vaccine is distributed but it allows for arbitrary number of doses. At the end of this vignette we describe the dose allocation algorithm.
Start by making parameters. Note that get_vaccine_ab_titre_parameters gets parameters giving antibody titre and decay rates for each supported vaccine type, and that make_vaccine_parameters does final type checking and combines the different parameters into a single list for the simulation. The function make_vaccine_parameters uses a strategy_matrix which is the output of strategy_matrix in nimue. A user can either provide a single matrix that will give the strategy used to allocate all phases (all doses), or a list of matrices, one for each dosing phase.
iso3c <- "GBR"
pop <- safir::get_population(iso3c)
pop$n <- as.integer(pop$n / 1e3)
contact_mat <- squire::get_mixing_matrix(iso3c = iso3c)

tmax <- 100
dt <- 0.5
R0 <- 4

# vaccine dosing
vaccine_doses <- 2
dose_period <- c(NaN, 28)
vaccine_set <- c(0, seq(from = 1e3, to = 1e4, length.out = tmax-1))
vaccine_set <- floor(vaccine_set)

# vaccine strategy
vaccine_coverage_mat <- strategy_matrix(strategy = "Elderly",max_coverage = 0.2)
next_dose_priority <- matrix(data = 0, nrow = vaccine_doses - 1,ncol = ncol(vaccine_coverage_mat))
next_dose_priority[1, 15:17] <- 1 # prioritize 3 oldest age groups for next dose

# base parameters
parameters <- safir::get_parameters(
  population = pop$n,
  contact_matrix_set = contact_mat,
  iso3c = iso3c,
  R0 = R0,
  time_period = tmax,
  dt = dt
)

# vaccine parameters
ab_parameters <- get_vaccine_ab_titre_parameters(vaccine = "Pfizer", max_dose = vaccine_doses,correlated = FALSE)

# combine parameters and verify
parameters <- make_vaccine_parameters(
  safir_parameters = parameters,
  vaccine_ab_parameters = ab_parameters,
  vaccine_set = vaccine_set,
  dose_period = dose_period,
  strategy_matrix = vaccine_coverage_mat,
  next_dose_priority_matrix = next_dose_priority
)
Run safir
Now we make the variables, events, and processes used in the model. In order to track the antibody titre for each vaccinated person, we use a custom function double_count_render_process_daily to write to the output matrix; this is because currently individual does not support renderers that track DoubleVariable objects. Unless the antibody titres are a direct object of analysis, it is recommended to not output them, as it slows down the simulation.
As usual, for actual use, please use only the minimum number of output/rendering needed for your analysis, as it increases run time. In particular, double_count_render_process_daily to output the antibody titre for each person each day is time consuming.
# create variables
timesteps <- parameters$time_period/dt
variables <- create_variables(pop = pop, parameters = parameters)
variables <- create_vaccine_variables(variables = variables,parameters = parameters)

# create events
events <- create_events(parameters = parameters)
events <- create_events_vaccination(events = events,parameters = parameters)
attach_event_listeners(variables = variables,events = events,parameters = parameters, dt = dt)
attach_event_listeners_vaccination(variables = variables,events = events,parameters = parameters,dt = dt)

# make renderers
renderer <- Render$new(parameters$time_period)
nat_renderer <- Render$new(parameters$time_period)
dose_renderer <- Render$new(parameters$time_period)

double_count_render_process_daily <- function(renderer, variable, dt) {
  stopifnot(inherits(variable, "DoubleVariable"))
  stopifnot(inherits(renderer, "Render"))
  function(t) {
    if ((t * dt) %% 1 == 0) {
      day <- as.integer(t * dt)
      nat <- exp(variable$get_values())
      quantiles <- quantile(x = nat, probs = c(0.025, 0.5, 0.975))
      renderer$render(name = "q025", value = quantiles[[1]], timestep = day)
      renderer$render(name = "q5", value = quantiles[[2]], timestep = day)
      renderer$render(name = "q975", value = quantiles[[3]], timestep = day)
      renderer$render(name = "mean", value = mean(x = nat), timestep = day)
    }
  }
}

# processes
processes <- list(
  vaccine_ab_titre_process(parameters = parameters,variables = variables,dt = dt),
  vaccination_process(parameters = parameters,variables = variables,events = events,dt = dt),
  infection_process_vaccine_cpp(parameters = parameters,variables = variables,events = events,dt = dt),
  categorical_count_renderer_process_daily(renderer = renderer,variable = variables$states,categories = variables$states$get_categories(),dt = dt),
  double_count_render_process_daily(renderer = nat_renderer, variable = variables$ab_titre, dt = dt),
  integer_count_render_process_daily(renderer = dose_renderer,variable = variables$dose_num,margin = 0:vaccine_doses,dt = dt)
)

setup_events(parameters = parameters,events = events,variables = variables,dt = dt)
Run the simulation.
system.time(simulation_loop_safir(
    variables = variables,
    events = events,
    processes = processes,
    timesteps = timesteps,
    variables_dont_update = c("discrete_age", "phase"),
    progress = FALSE
))
#>    user  system elapsed
#>  12.460   0.016  12.480
Plot Results
Antibody titre
This lets us check if people are getting vaccinated; Ab titre, averaged over the population, relative to the time of the first dose. It won’t look like the cohort plots because everybody gets their second dose at slightly different times, depending on availability.
ab_titre_dt <- as.data.table(nat_renderer$to_dataframe())
setnames(ab_titre_dt, "timestep", "Day")

ggplot(data = ab_titre_dt) +
  geom_line(aes(x=Day,y=mean)) +
  geom_ribbon(aes(x=Day,ymin=q025,ymax=q975),alpha=0.5) +
  theme_bw()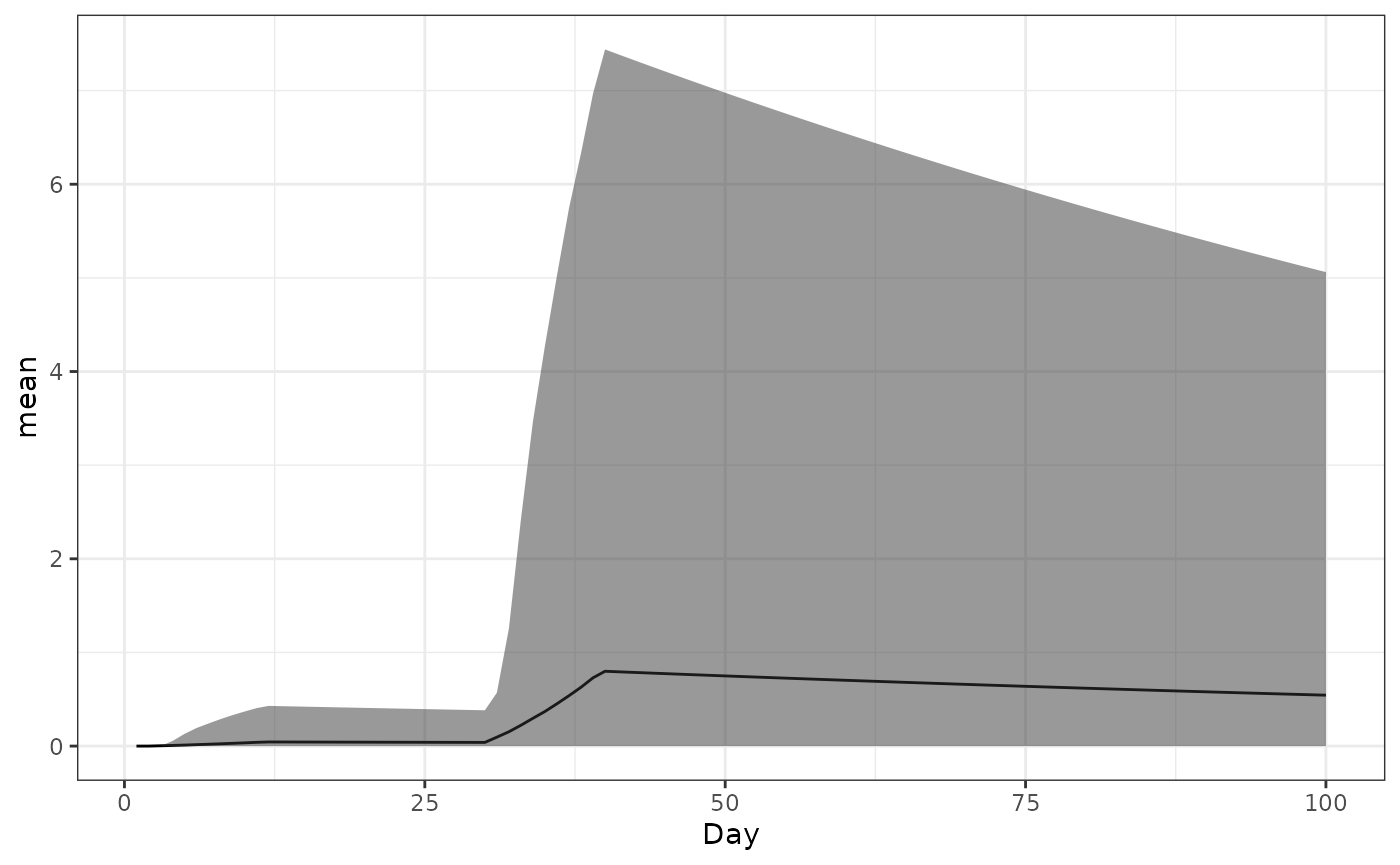
Proportion of population with each dose
We also want to plot the number of people with each dose over time to check it’s working.
dose_out <- dose_renderer$to_dataframe()
colnames(dose_out)[2:(vaccine_doses+2)] <- as.character(0:vaccine_doses)
dose_out <- melt(as.data.table(dose_out),id.vars="timestep")
setnames(dose_out, "variable", "dose")

ggplot(data = dose_out) +
  geom_line(aes(x=timestep,y=value,color=dose)) +
  theme_bw()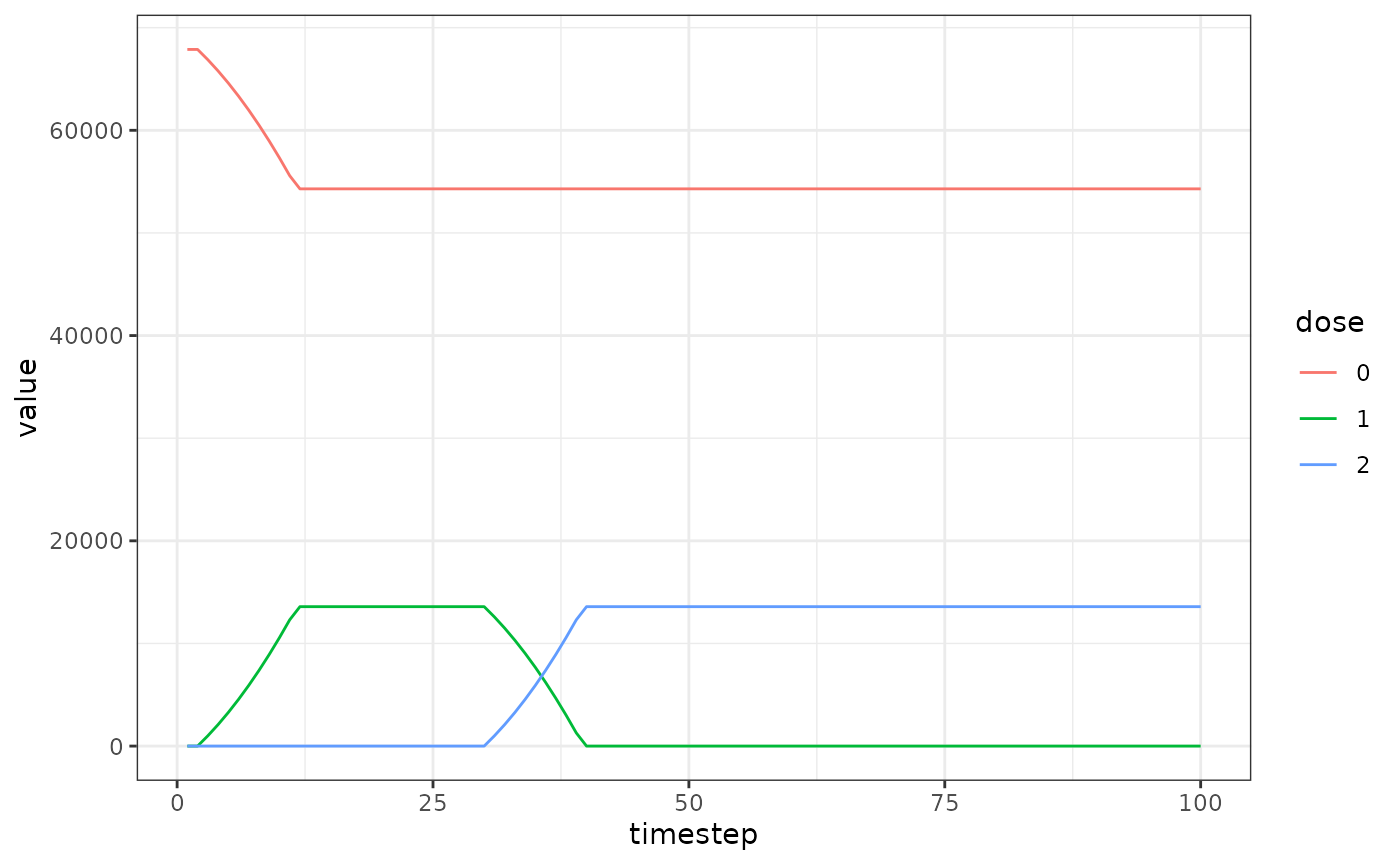
Infection states
The compartmental states of the model.
saf_dt <- as.data.table(renderer$to_dataframe())
saf_dt[, IMild_count := IMild_count + IAsymp_count]
saf_dt[, IAsymp_count := NULL]
saf_dt <- melt(saf_dt,id.vars = c("timestep"),variable.name = "name")
saf_dt[, name := gsub("(^)(\\w*)(_count)", "\\2", name)]
setnames(x = saf_dt,old = c("timestep","name","value"),new = c("t","compartment","y"))

ggplot(data = saf_dt, aes(t,y,color = compartment)) +
  geom_line() +
  geom_line() +
  facet_wrap(~compartment, scales = "free")
Code design
Variables
create_vaccine_variables attaches various variable types and other data to the variables list needed to simulate vaccine allocation and antibody titre dynamics. It can be found in R/variables_vaccines.R.
Antibody titre dynamics process
The process vaccine_ab_titre_process calculates daily updates for antibody titres for everyone in the population who has received at least one dose of the vaccine. For each vaccinated individual, the time since their last dose is found, which is used to find the daily decay rate which is used to update their Ab titre. Efficacy against infection and against severe disease are also calculated at this time.
New values for ab titres are drawn when individuals are given a vaccine dose, but these are found in schedule_dose_vaccine in R/events_vaccination.R and are described later.
The code can be found in R/efficacy_vaccination.R.
Vaccine allocation process
The vaccine dose allocation algorithm is designed to be as similar as possible to the weighted_efficacy function from nimue, generalized to an arbitrary number of doses. The vaccination process is vaccination_process and can be found in R/process_vaccination.R with many supporting functions in R/distribution_vaccines.R.
Vaccine dosing is split into phases, from 1 to the total number of doses. On phase i, dose i is administered to the population until conditions are met. In order to determine when to advance from phase i to i+1, a strategy matrix (coverage prioritisation matrix) is provided, which can be shared across all phases, or a unique strategy matrix for each phase. The strategy matrix used as input to safir is exactly the same as the one described in nimue, which is created using the nimue function strategy_matrix. There is an additional piece of input next_dose_priority which describes which (if any) age groups are prioritized for dose i+1 while still on phase i (similar to the argument d2_prioritise from weighted_efficacy).
In order to advance from phase i to i+1, each row (step) of the strategy matrix for that phase must have its coverage targets fulfilled. Additionally, those age groups specified by next_dose_priority must have their next dose coverage targets fulfilled at the same level given by each step of the strategy matrix. Because the strategy matrix will be stepped through before the phase can advance, when the phase goes from i to i+1, we are guaranteed that coverage targets for dose i (and prioritized targets for dose i+1, if any) have been met at the final row of the strategy matrix (the final step).
The algorithm distributes doses until all phases are complete, at which point no more doses are given, even if there is sufficient supply.
On a timestep, the algorithm has the following stages (see vaccination_process in R/process_vaccination.R):
- Given the current phase (dose) being distributed, find out what step of the prioritisation/strategy matrix the algorithm has attained, based on current coverage for that dose compared against coverage targets in the rows of the strategy matrix; if
next_dose_priorityhas non-zero entries, compare those too for the next dose. - If all coverage targets (all rows) of the strategy matrix are fulfilled, step to the next dosing phase.
- Based on this
stepof the strategy matrix for thisphase, find eligible persons (based on what age groups are being targeted, and if the minimum inter-dose time interval has elapsed, ifphase > 1). Assign as many doses as possible to these persons. - If doses remain and this is not the last
phase, assign the next dose to those persons prioritized based onnext_dose_priority. - If doses remain, step through the remaining rows of the strategy matrix, assigning doses to individuals in groups that have not yet met their targets.
Infection process
The infection process can either use an R implementation infection_process_vaccine or C++ implementation infection_process_vaccine_cpp. The R version is in R/process_infection_vaccine.R and the C++ one in src/process_infection_vaccine.cpp.
Vaccine events
create_events_vaccination attaches additional individual::TargetedEvent objects to the events list to schedule doses for eligible individuals. attach_event_listeners_vaccination and setup_events_vaccine attach listeners and initialize the initial model state, respectively. These functions can be round in R/events_vaccination.R.