Coverage and Prioritisation
Coverage_and_Prioritisation.RmdThe nimue model allows us to specify age-dependent and prioritised
coverage targets. These are defined by using the
vaccine_coverage_mat argument. This is a coverage
prioritisation matrix, with each column representing one of the 17
5-year age groups in the model and each row representing a step in our
prioritisation. The model will vaccinate all age groups in the current
prioritisation step until all target coverages in that step have been
achieved, at which point it will move to the next prioritisation step.
The default vaccine_coverage_mat is a simple matrix with a
single prioritisation step (row) and all values 0.8 - in this cases we
target all age-groups at the same time and continue vaccinating until
all have achieved 80% coverage.
Nimue, includes some built-in prioritisation matrices, which are a
good place to start to understand how to parameterise more complex
strategies. See ?strategy_matrix for all options
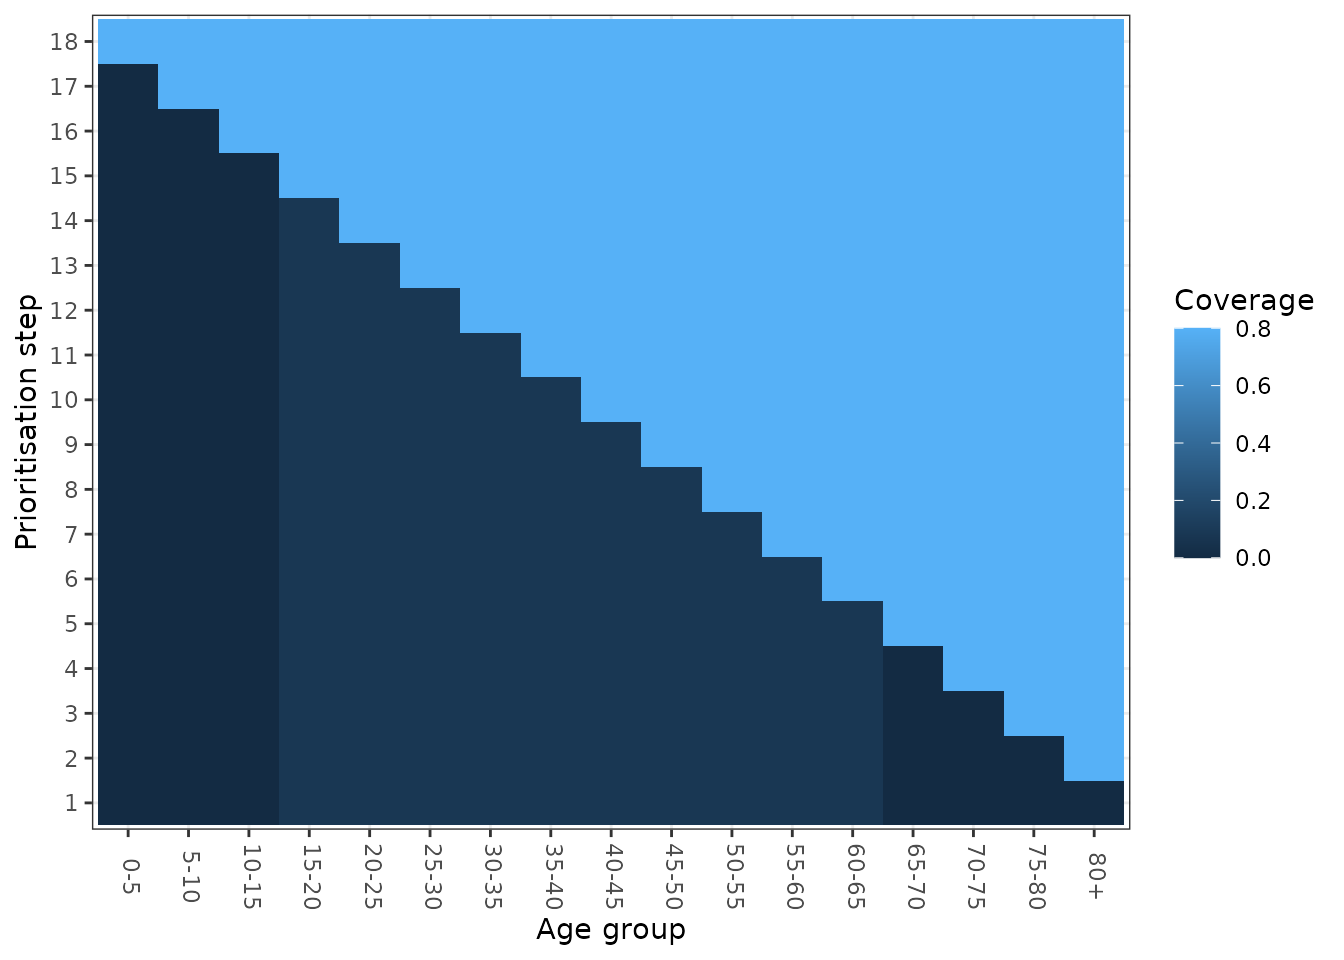
Targeting the elderly first
# Parameterise a strategy matrix
elderly <- strategy_matrix(strategy = "Elderly",
                           max_coverage = 0.8)

# Visualise
plot_matrix <- function(mat){
  age_labels <- c(paste0(seq(0, 75, 5), "-", seq(5, 80, 5)), "80+")
  colnames(mat) <- age_labels
  rownames(mat) <- 1:nrow(mat)
  pd <- as.data.frame.table(mat)
  colnames(pd) <- c("Prioritisation step", "Age group", "Coverage")
  ggplot(pd, aes(y = `Prioritisation step`, x = `Age group`, fill = Coverage)) +
    geom_tile() +
    theme_bw() +
    theme(axis.text.x=element_text(angle = -90, vjust = 0.3))
}

plot_matrix(elderly)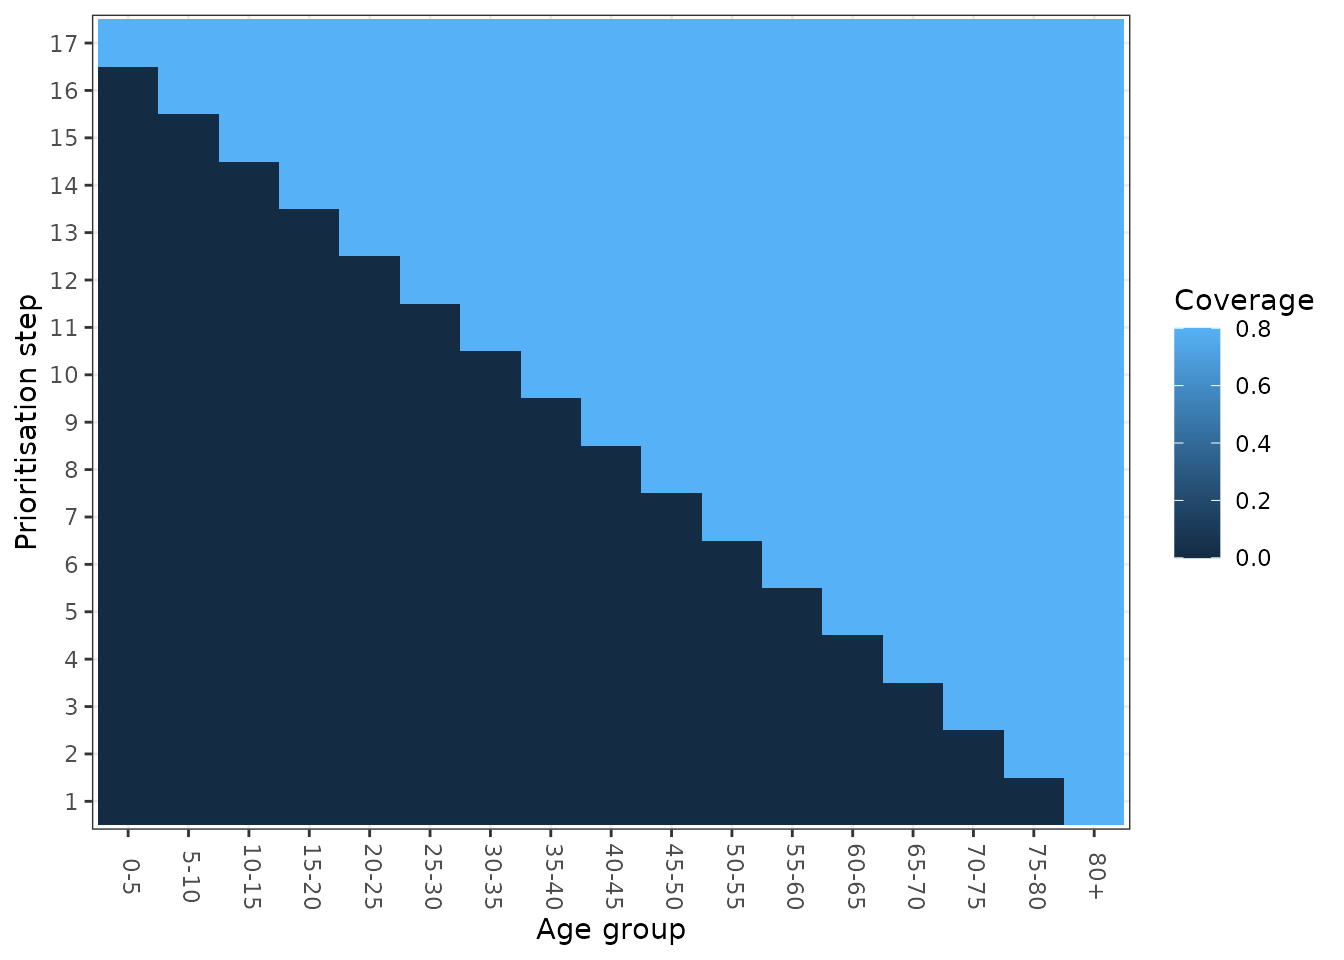
Targeting at-risk, elderly, working-age then children
Prioritise a sub-population of those of working age, followed by the elderly and continuing in a stepwise fashion, moving from the oldest age group down
# Parameterise a strategy matrix
at_risk <- strategy_matrix(strategy = "Risk Elderly Working Children step",
                           max_coverage = 0.8,
                           risk_proportion = 0.1)

# Visualise
plot_matrix(at_risk)