Supply
Supply.RmdWe can model a scale-up of supply capacity for vaccines
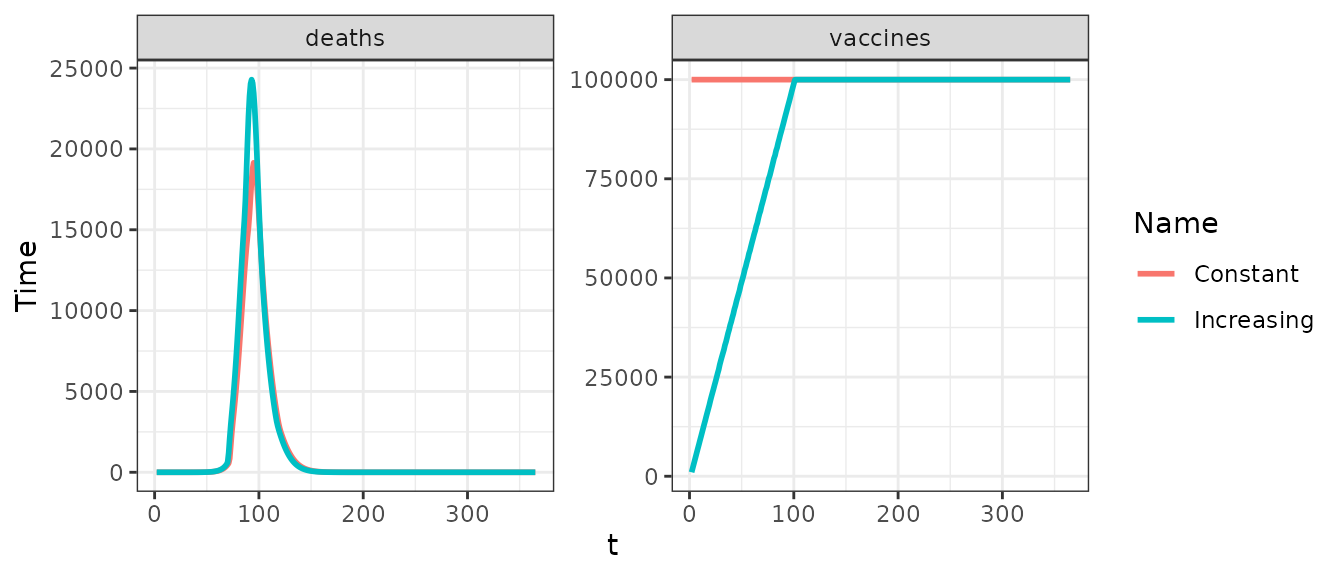
No initial supply constraint
To begin, we can run the model with no supply constraints - in this case we immediately have the ability to vaccinate 100,000 individuals per day:
# Run the with no vaccine supply constraint
constant <- run(
  country = "United Kingdom",
  max_vaccine = 100000,
  vaccine_efficacy_disease = rep(0, 17),
  vaccine_efficacy_infection = rep(0.9, 17)
)
# Format the output selecting vaccines and deaths
o1 <- format(constant, compartments = NULL, summaries = c("deaths", "vaccines")) %>%
  mutate(Name = "Constant")
Initial supply constraint
A more realistic scenario might see us ramp up our supply capcity over time, in this case ramping up to our target of vaccinating 100,000 people per day over a period of 100 days:
# Run with initial vaccine supply constraints
increasing <- run(
  country = "United Kingdom",
  max_vaccine = seq(0, 100000, length.out = 100),
  tt_vaccine = seq(0, 100, length.out = 100),
  vaccine_efficacy_disease = rep(0, 17),
  vaccine_efficacy_infection = rep(0.9, 17)
)
# Format the output selecting vaccines and deaths
o2 <- format(increasing, compartments = NULL, summaries = c("deaths", "vaccines")) %>%
  mutate(Name = "Increasing")