Multilevel example with blocks
Bob Verity and Pete Winskill
2024-06-26
Source:vignettes/checks_multilevel_blocks.Rmd
checks_multilevel_blocks.Rmd## Registered S3 method overwritten by 'GGally':
## method from
## +.gg ggplot2Purpose: to compare drjacoby infered posterior distribution against the exact analytical solution in a multi-level model implemented via likelihood blocks.
Model
There are g groups with means mu_1 to
mu_g. These component means are drawn from a normal
distribution with mean 0 and sd 1.0. Within each group there are
n observations drawn around each component mean from normal
disribution with sd 1.0.
g <- 5
mu <- rnorm(g)

n <- 5
data_list <- list()
for (i in 1:g) {
  data_list[[i]] <- rnorm(n, mean = mu[i])
}
names(data_list) <- sprintf("group%s", 1:g)
Likelihood and prior:
Parameters dataframe:
MCMC
mcmc <- run_mcmc(data = data_list,
df_params = df_params,
loglike = "loglike",
logprior = "logprior",
burnin = 1e3,
samples = 1e5,
chains = 10,
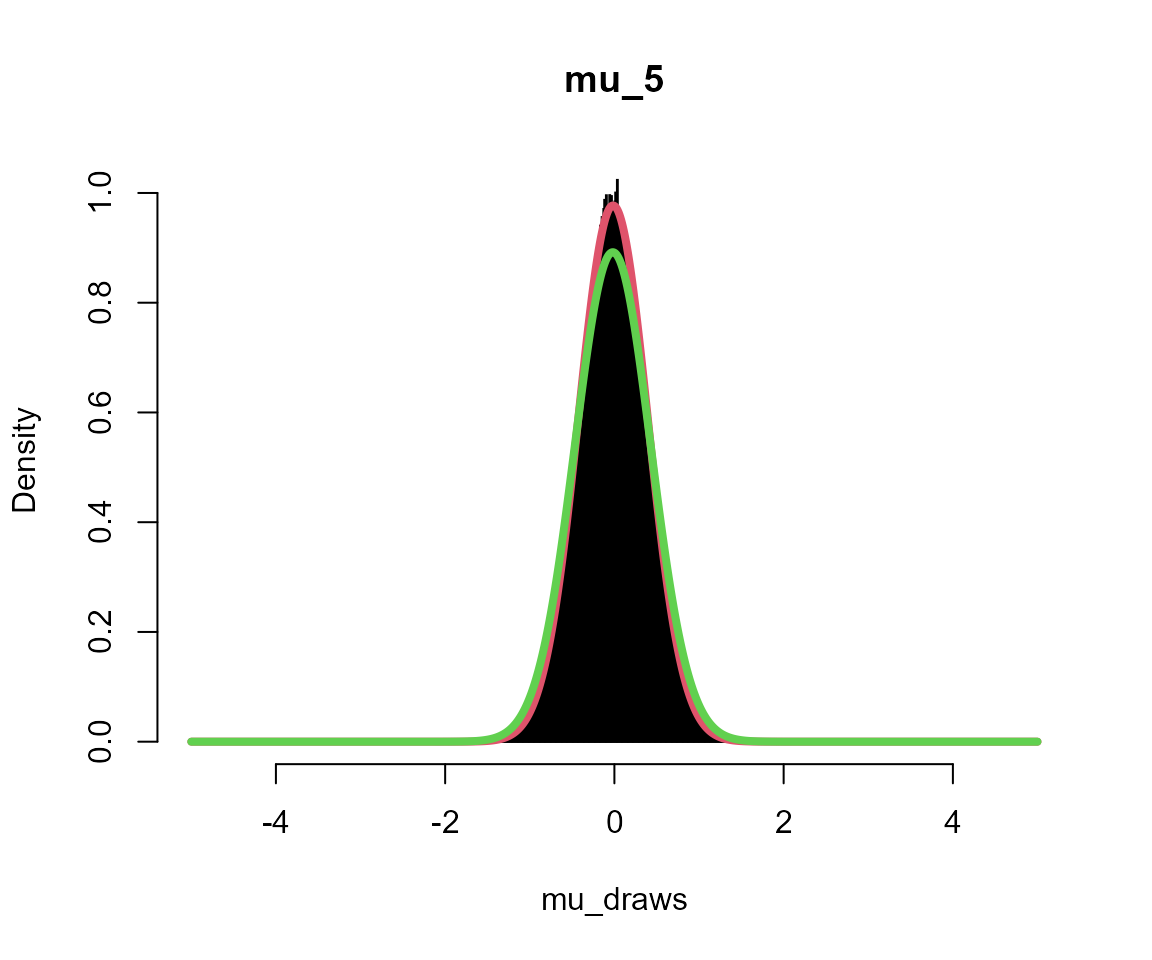
silent = TRUE)Plots
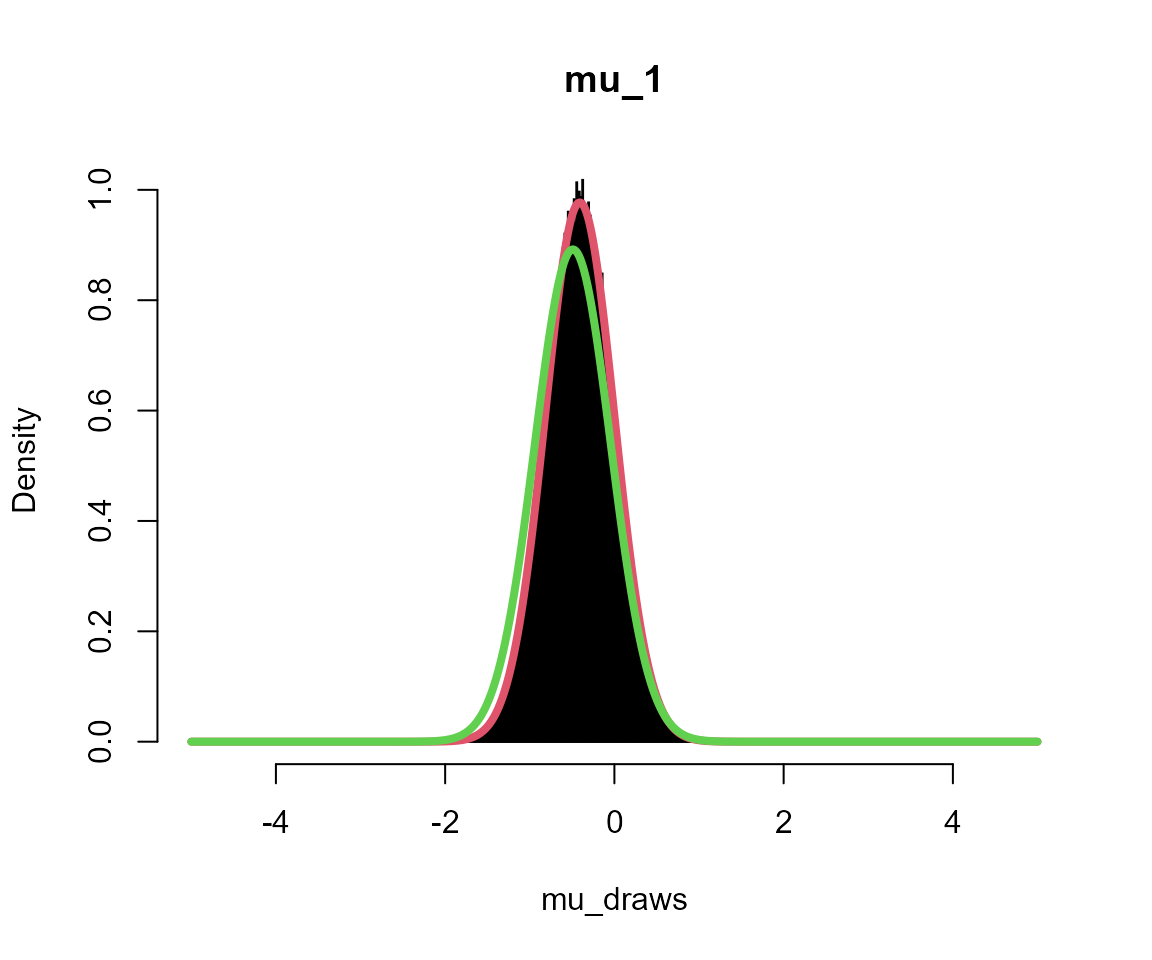
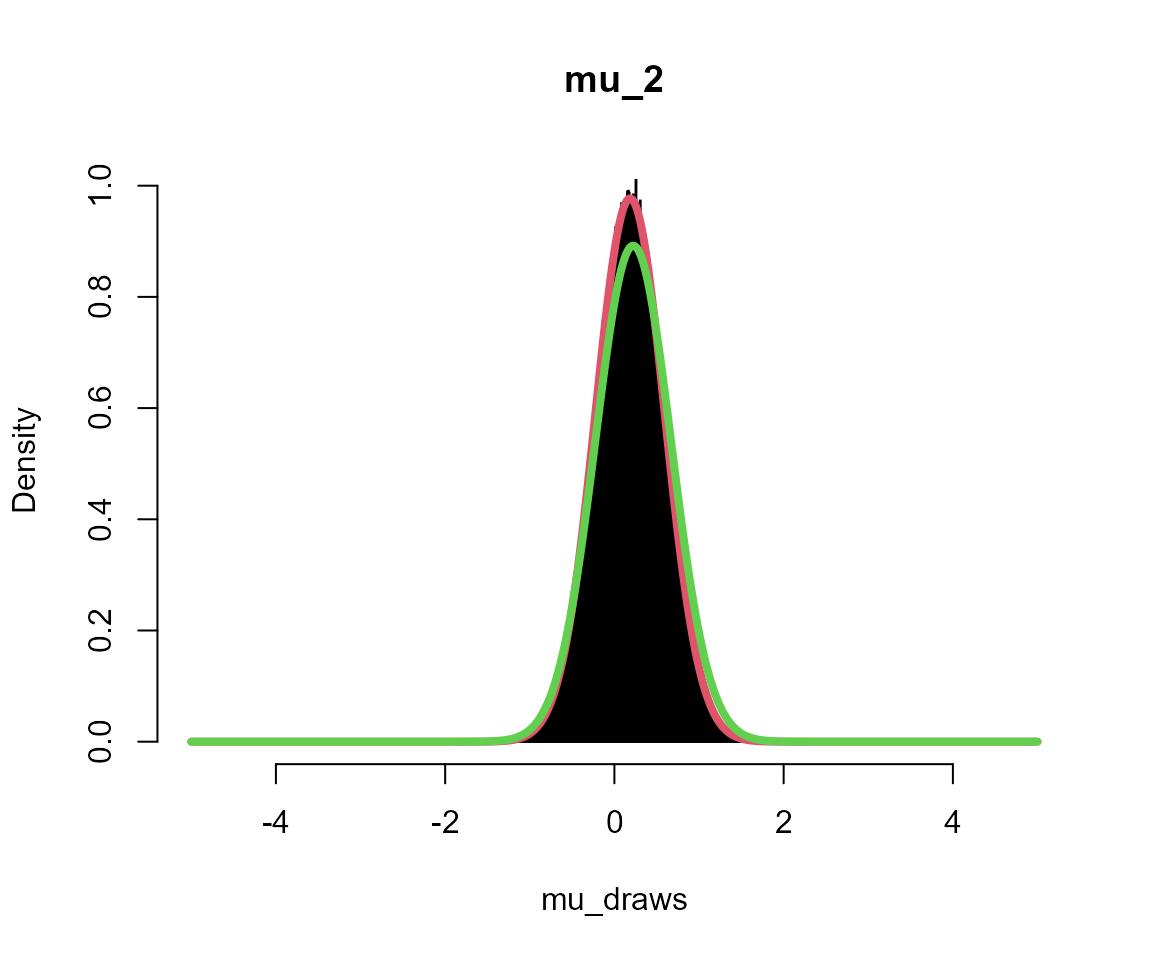
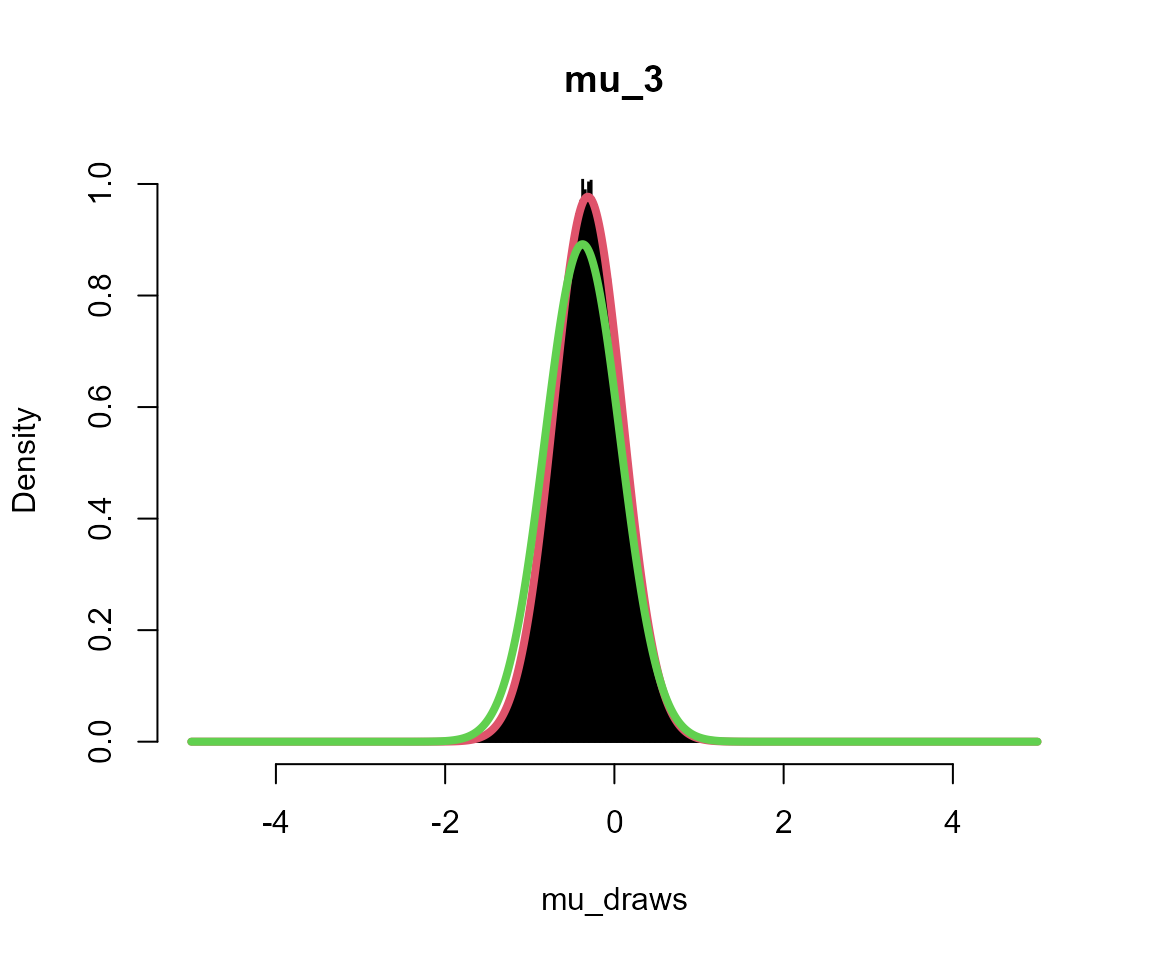
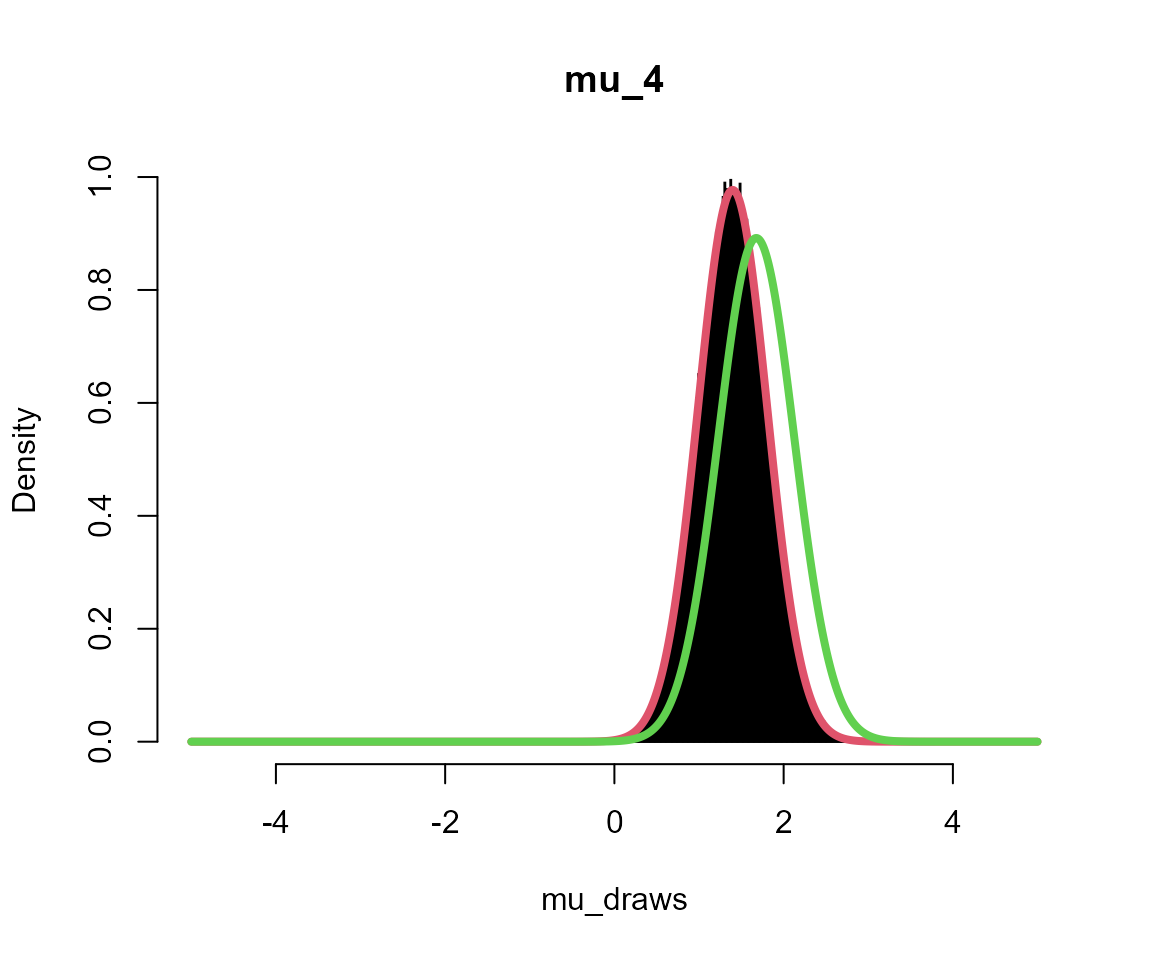
Black = posterior draws
Red = analytical solution to multi-level model
Green = analytical solution assuming independent groups (no second level)
# extract sampling draws
output_sub <- subset(mcmc$output, phase == "sampling")

for (i in 1:5) {
  # get posterior draws
  mu_draws <- output_sub[[sprintf("mu_%s", i)]]

  # get analytical solution for this group
  x <- seq(-L, L, l = 1001)
  m <- mean(data_list[[i]])
  fx <- dnorm(x, mean = m * n/(n + 1), sd = sqrt(1/(n + 1)))

  # get analytical solution if no multi-level model
  fx2 <- dnorm(x, mean = m, sd = sqrt(1/n))

  # overlay plots
  hist(mu_draws, breaks = seq(-L, L, l = 1001), probability = TRUE, col = "black",
       main = sprintf("mu_%s", i))
  lines(x, fx, col = 2, lwd = 4)
  lines(x, fx2, col = 3, lwd = 4)
}