Population prevalence, incidence and EIR
Bob Verity
Last updated: 30 Mar 2023
Source:vignettes/data_prev_inc.Rmd
data_prev_inc.RmdThis report aims to:
- Explore the relationships bewteen key transmission-related quantities, such as prevalence, incidence and the entomological inoculation rate (EIR).
- Gain insights into these relationships that will help with model development.
EIR vs. prevalence
Hay et al. (2005)
Data: EIR_prev_hay2005
Our first dataset comes from a study by Hay et al. (2005) looking into the impact of urbanisation on malaria transmission in Africa. The study uses the term APfEIR to refer to the “annual P. falciparum entomological inoculation rate”, although we will use the shorthand term “EIR” here to mean the same thing. Most of the data are derived from an earlier study that identified 159 spatially distinct records in Africa, post 1980, and determined a mean EIR estimate of 121 ibpppy (infectious bites per person per year) with a range of 0 - 884 across the continent. The EIR in this earlier study was defined as the number of P. falciparum bites per adult per night indoors, using human biting rates that were averaged over one year and standardised to human bait catch equivalents on adults. These data were supplemented with 74 additional studies, all available on the online supplementary information, resulting in \(n = 233\) temporally and spatially distinct EIR estimates from 22 countries in Africa between 1980 and 2004. Hay et al. explored these data in terms of urban/rural patterns (not shown here).
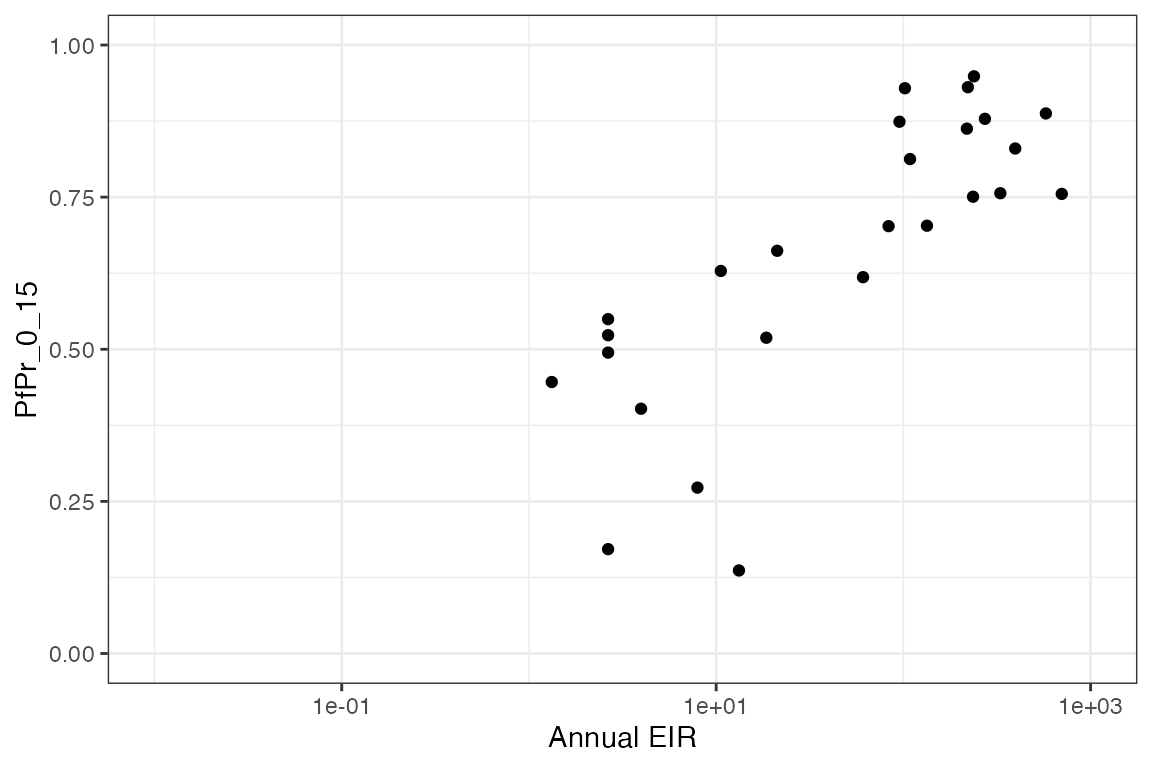
The authors were able to match 130 of these EIR estimates against contemporaneous surveys of parasite prevalence ratio (PR). The terminology in this area can get confusing, with terms like “rate”, “ratio” and “proportion” being used interchangeably when in fact they have slightly different defitions mathematically. They define PR as “the proportion of a population who have P. falciparum in their blood”, which is generally understood as the prevalence, and so will use the term “prevalence” here in place of PR to avoid confusion. Specifically, surveys were chosen that collected prevalence data in children (<15 years). We will assume
A simple scatterplot of EIR vs. prevalence reveals a strong log-linear relationship.
A good number to keep in mind is that an EIR of around 10 ibpppy corresponds to a prevalence (by microscopy) of around 50%.
Beier et al. (1999)
Data: EIR_prev_beier1999
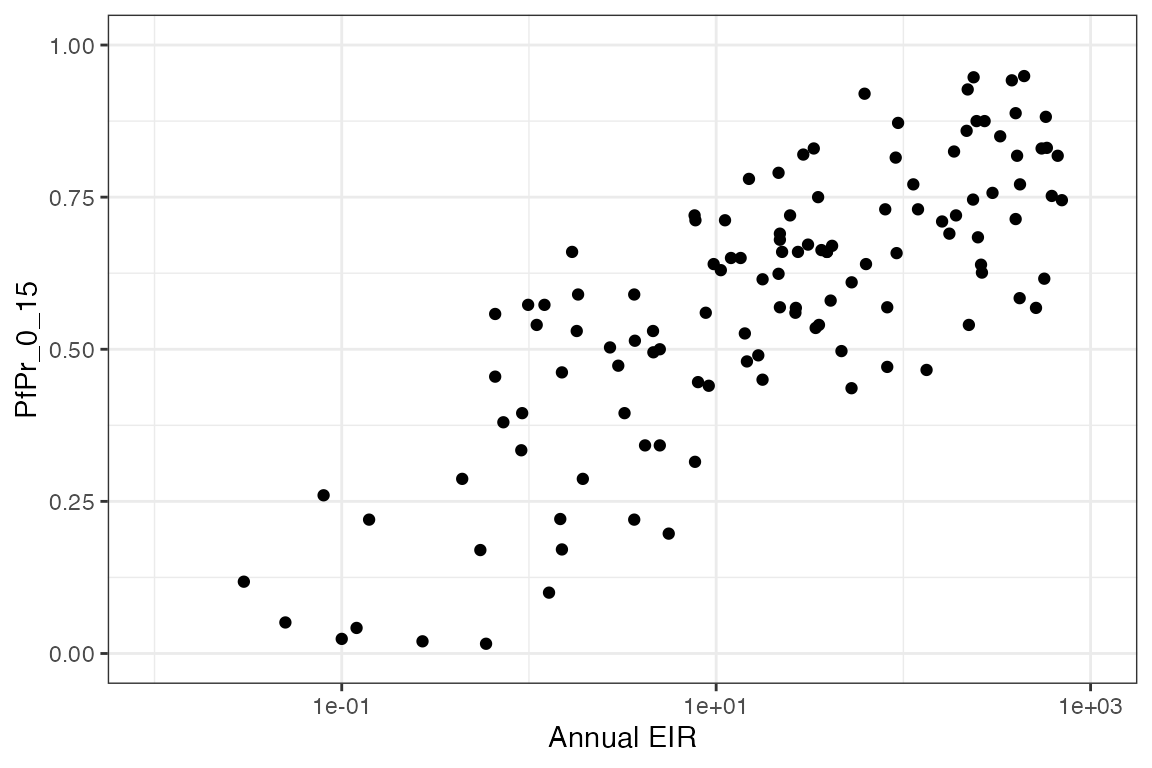
An earlier study by Beier et al. (1999) looked into similar patterns in published data. Here, prevalence is defined as that determined by standard thick/thin blood smear microscopy techniques. To provide a consistent principle for comparing datasets that differ in how prevalence was determined and reported, the authors chose to take the maximum prevalence for any designated age group as the single value for each site. Hence, these values should be seen as quite pessimistic, representing the worst public health effect due to an associated EIR.
These data show a very similar log-linear trend: