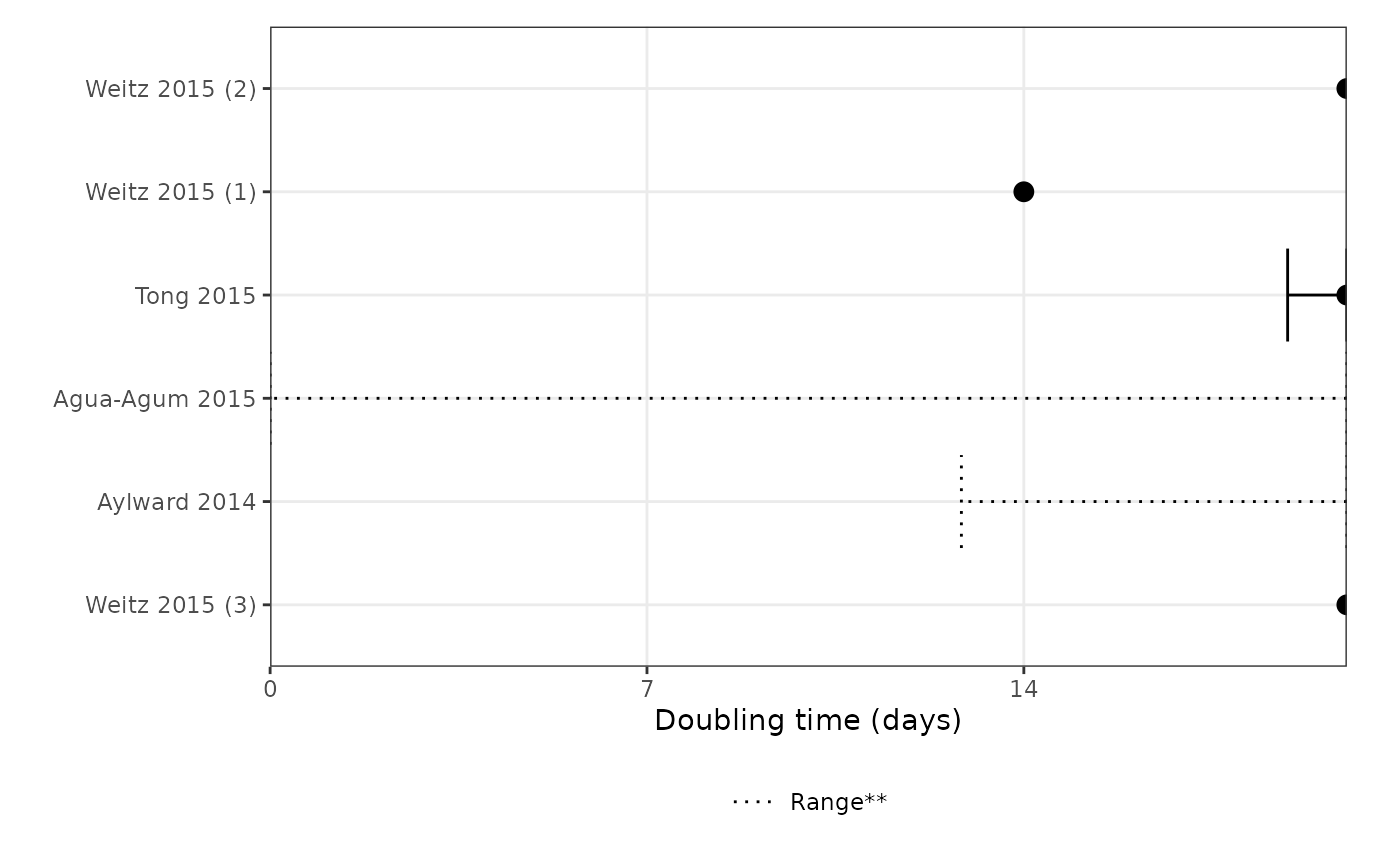
This function calculates the doubling time and creates a forest plot to visualize the results.
Arguments
- df
The data frame containing the necessary data for generating the forest plot.
- ulim
The upper limit for the x-axis of the plot. Default is 10.
- reorder_studies
Logical. If TRUE, the studies will be reordered using the
reorder_studiesfunction. Default is TRUE.- ...
Additional arguments to be passed to the
forest_plotfunction.
Examples
df <- load_epidata("ebola")[["params"]]
#> ℹ ebola does not have any extracted outbreaks
#> information. Outbreaks will be set to NULL.
#> ✔ Data loaded for ebola
forest_plot_doubling_time(df, ulim = 20, reorder_studies = TRUE)
#> Warning: The maximum doubling time is 61 ; the ulim is set to 20 . Some points may not
#> be plotted. Consider increasing ulim.
#> Warning: No parameters to invert.
#> Warning: Removed 2 rows containing missing values or values outside the scale range
#> (`geom_point()`).