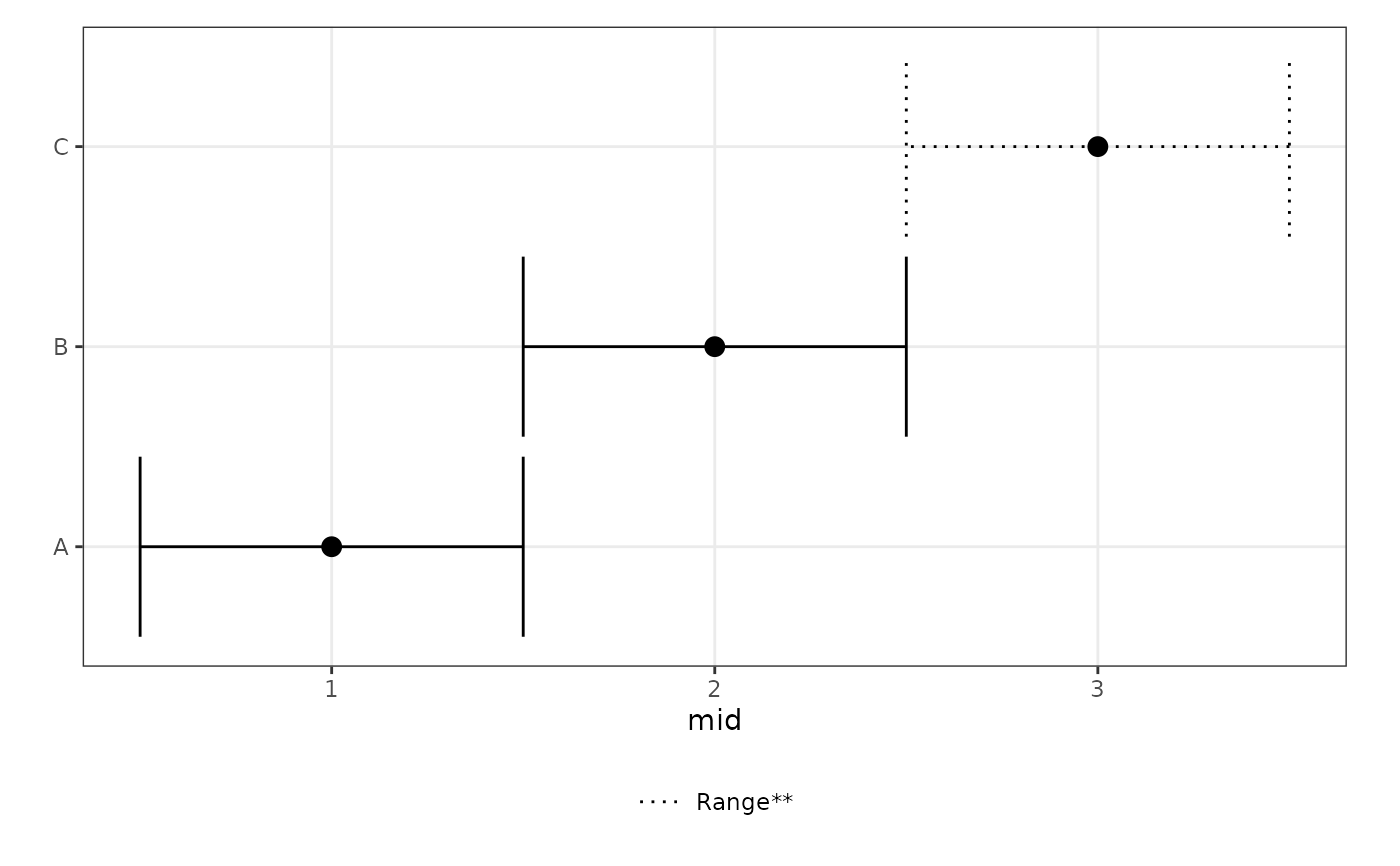
Basic forest plot displays central estimate and uncertainty for a parameter from different studies. y-axis lists the study labels and the x-axis displays parameter.
Usage
forest_plot(
  df,
  facet_by = NA,
  shape_by = NA,
  col_by = NA,
  shp_palette = NULL,
  col_palette = NULL,
  unique_label = NA
)
Arguments
- df
The data frame containing the data for the forest plot. data.frame with the following fields: article, label, mid, low, high The field 'y' is mapped to the y-axis with 'article_label' used as a display label. mid refers to the central estimate. low and high represent the lower and higher ends of the uncertainty interval
- facet_by
(Optional) Variable to facet the plot by.
- shape_by
(Optional) Variable to shape the points by.
- col_by
(Optional) Variable to color the points by.
- shp_palette
(Optional) Palette for shaping the points. Optional unless shape_by is not one of 'parameter_value_type'.
- col_palette
Palette for coloring the points. Optional unless col_by is not one of 'parameter_type' or 'population_country'.
- unique_label
(Optional) User can provide custom labels for forest plot y-axis. Must match length of dataframe.