Runs get_joint() to obtain the joint posterior
distribution of the prevalence and the ICC. Creates a ggplot contour plot
object from this result.
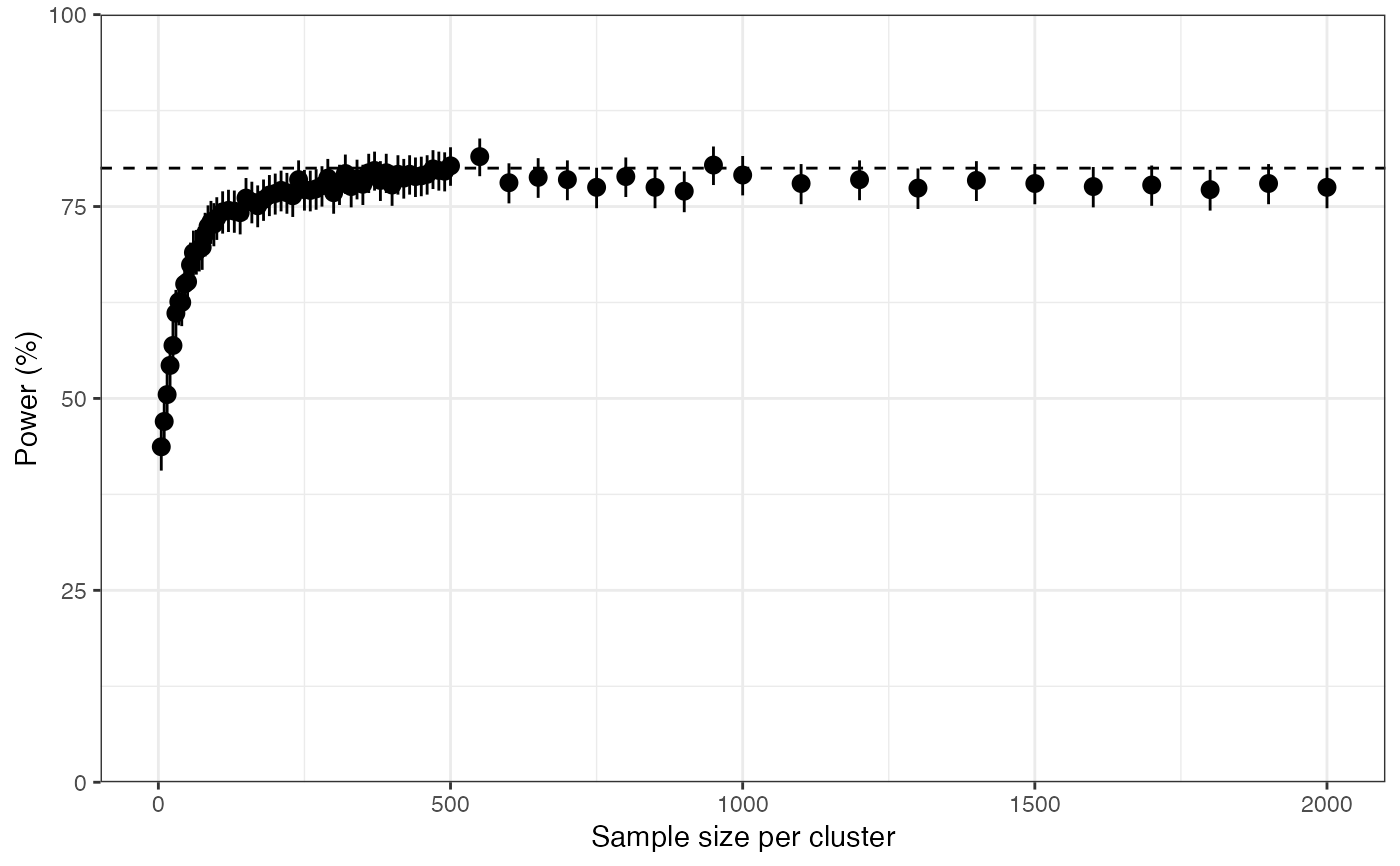
plot_power(
  n_clust = 5,
  prevalence = 0.1,
  ICC = 0.05,
  prev_thresh = 0.05,
  N_min = 1,
  N_max = 2000
)
Arguments
- n_clust
the number of clusters. Allowed values are anything in
2:20, including vectors of values.- prevalence
the assumed true prevalence of pfhrp2/3 deletions in the domain. Allowed values are anything in
seq(0, 0.2, 0.01), including vectors of values.- ICC
the assumed intra-cluster correlation. Allowed values are" {0, 0.01, 0.02, 0.05, 0.1, 0.2}.
- prev_thresh
the prevalence threshold against which we are comparing. Allowed values are: {0.05, 0.08, 0.1}.
- N_min, N_max
plotting limits on the x-axis.
Examples
plot_power()