Historical analysis
Bob Verity
Last updated: 08 Nov 2024
Source:vignettes/historical_analysis.Rmd
historical_analysis.Rmd1. Available data on pfhrp2/3 deletions
Our objective here is to learn from historical pfhrp2/3 studies and to use this information to increase the power and validity of our approach. In particular, we are interested in coming up with sensible values for the intra-cluster correlation coefficient (ICC). Estimates of the ICC from historical data are vastly better than simple rules of thumb (e.g. using 1.5 for the design effect) and thankfully the Bayesian framework gives us an excellent way of incorporating this information into our analysis.
A large number of pfhrp2/3 studies can be explored through the WHO malaria threats map. We downloaded all pfhrp2/3 data from this website on 27 Nov 2023. The resulting file can be found in the Github repos for this tool inside the folder. Note the term in this file name - this is because two additional columns were added manually, which are called and . These columns specify certain rows that should be discarded because of issues in the raw data, for example data entry mistakes. We then performed the following filtering steps:
- Remove raw data mistakes. Rows were dropped that were identified as having issues in the raw data.
- Continent. Filtered to Africa, Asia or South America.
- Patient type. We are only interested in clinically relevant pfhrp2/3 deletions, and so we focus on studies of symptomatic patients only.
- Study type. Filtered to convenience surveys or cross-sectional prospective surveys only.
- Merge per site. Combined counts (both tested and positive) of studies conducted in the same exact location (based on lat/lon) in the same year and from the same source publication. These are considered a single site.
- Number of samples. Filtered to have 10 or more samples per site. Avoids very small sample sizes that would contain very little information from the data and therefore would be driven by our prior assumptions.
- Map to ADMIN1. All sites were mapped to ADMIN1 level by comparing the lat/lon coordinates against a shapefile from GADM version 4.1.0, focusing on first administrative unit.
- Add further studies. Results were combined with studies that contain additional information not reflected in the WHO malaria threats map data. For example, some studies have site-level resolution despite not being apparent in the original data download. These additional studies can be found in the R_ignore/data folder under the name .
- Filter on number of sites. At this point, we have a combined dataset with all sites mapped to an ADMIN1 region. We filter to ADMIN1 regions that contain at least 3 distinct sites within the same year and from the same source publication. Setting a minimum number of sites per domain ensures that we have information about the ICC in our data, and again we avoid being driven by our prior assumptions.
The filtered data contains 6 studies and 7 ADMIN1 domains. This
filtered dataset is available within the package through the
historical_data object:
| CONTINENT_NAME | COUNTRY_NAME | ADMIN1_NAME | SITE_NAME | LONGITUDE | LATITUDE | YEAR_START | YEAR_END | HRP2_TESTED | HRP2_NUM_DELETION | CITATION_URL |
|---|---|---|---|---|---|---|---|---|---|---|
| Asia | India | Odisha | Central table land | 84.87502 | 21.191065 | 2013 | 2013 | 163 | 16 | https://malariajournal.biomedcentral.com/articles/10.1186/s12936-018-2502-3 |
| Asia | India | Odisha | Coastal Track, Odisha | 85.71103 | 20.048885 | 2013 | 2013 | 76 | 6 | https://malariajournal.biomedcentral.com/articles/10.1186/s12936-018-2502-3 |
| Asia | India | Odisha | Eastern Ghat | 82.74350 | 19.185838 | 2013 | 2013 | 48 | 7 | https://malariajournal.biomedcentral.com/articles/10.1186/s12936-018-2502-3 |
| Asia | India | Odisha | Northern Plateau | 85.58265 | 21.747202 | 2013 | 2013 | 97 | 9 | https://malariajournal.biomedcentral.com/articles/10.1186/s12936-018-2502-3 |
| South America | Peru | Loreto | Iquitos, Loreto | -73.25000 | -3.733333 | 2011 | 2011 | 159 | 123 | https://www.ncbi.nlm.nih.gov/pmc/articles/PMC9674673/#MOESM1 |
| South America | Peru | Loreto | Mazan, Loreto | -73.09550 | -3.495800 | 2009 | 2009 | 11 | 3 | http://pdf.usaid.gov/pdf_docs/PA00JT5W.pdf |
| South America | Peru | Loreto | Moronacocha, Loreto | -73.26376 | -3.748880 | 2011 | 2011 | 24 | 19 | https://www.ncbi.nlm.nih.gov/pmc/articles/PMC9674673/#MOESM1 |
| South America | Peru | Loreto | Padre cocha, Loreto | -73.27942 | -3.699667 | 2011 | 2011 | 140 | 109 | https://www.ncbi.nlm.nih.gov/pmc/articles/PMC9674673/#MOESM1 |
| South America | Peru | Loreto | Requena, Loreto | -74.51422 | -5.908611 | 2009 | 2009 | 11 | 11 | http://pdf.usaid.gov/pdf_docs/PA00JT5W.pdf |
| South America | Peru | Loreto | Soplin, Loreto | -74.49797 | -6.812799 | 2009 | 2009 | 31 | 8 | http://pdf.usaid.gov/pdf_docs/PA00JT5W.pdf |
| South America | Peru | Loreto | Yurimaguas, Loreto | -76.17766 | -5.807148 | 2009 | 2009 | 12 | 2 | http://pdf.usaid.gov/pdf_docs/PA00JT5W.pdf |
| Africa | Ethiopia | Benshangul-Gumaz | Sherkole Health Centre | NA | NA | 2018 | 2018 | 94 | 14 | https://www.ncbi.nlm.nih.gov/pmc/articles/PMC8095343/ |
| Africa | Ethiopia | Benshangul-Gumaz | Bambasi Health Centre | NA | NA | 2018 | 2018 | 66 | 9 | https://www.ncbi.nlm.nih.gov/pmc/articles/PMC8095343/ |
| Africa | Ethiopia | Benshangul-Gumaz | Kurmuk Health Centre | NA | NA | 2018 | 2018 | 42 | 10 | https://www.ncbi.nlm.nih.gov/pmc/articles/PMC8095343/ |
| Africa | Ethiopia | Benshangul-Gumaz | Assosa Health Centre | NA | NA | 2018 | 2018 | 16 | 6 | https://www.ncbi.nlm.nih.gov/pmc/articles/PMC8095343/ |
| Africa | Ethiopia | Tigray | Ahferom | NA | NA | 2017 | 2018 | 117 | 18 | https://www.ncbi.nlm.nih.gov/pmc/articles/PMC8478644/ |
| Africa | Ethiopia | Tigray | Atseged Tsimbila | NA | NA | 2017 | 2018 | 160 | 48 | https://www.ncbi.nlm.nih.gov/pmc/articles/PMC8478644/ |
| Africa | Ethiopia | Tigray | Gulomekeda | NA | NA | 2017 | 2018 | 21 | 5 | https://www.ncbi.nlm.nih.gov/pmc/articles/PMC8478644/ |
| Africa | Ethiopia | Tigray | K. Humera | NA | NA | 2017 | 2018 | 176 | 39 | https://www.ncbi.nlm.nih.gov/pmc/articles/PMC8478644/ |
| Africa | Ethiopia | Tigray | L. Adiabo | NA | NA | 2017 | 2018 | 145 | 22 | https://www.ncbi.nlm.nih.gov/pmc/articles/PMC8478644/ |
| Africa | Ethiopia | Tigray | T. Adiabo | NA | NA | 2017 | 2018 | 69 | 10 | https://www.ncbi.nlm.nih.gov/pmc/articles/PMC8478644/ |
| Africa | Ethiopia | Amhara | Metema | NA | NA | 2017 | 2018 | 233 | 30 | https://www.ncbi.nlm.nih.gov/pmc/articles/PMC8478644/ |
| Africa | Ethiopia | Amhara | Quara | NA | NA | 2017 | 2018 | 516 | 39 | https://www.ncbi.nlm.nih.gov/pmc/articles/PMC8478644/ |
| Africa | Ethiopia | Amhara | Tegede | NA | NA | 2017 | 2018 | 296 | 65 | https://www.ncbi.nlm.nih.gov/pmc/articles/PMC8478644/ |
| Africa | Ethiopia | Amhara | West Armachiho | NA | NA | 2017 | 2018 | 295 | 75 | https://www.ncbi.nlm.nih.gov/pmc/articles/PMC8478644/ |
| Africa | Eritrea | Gash Barka | Agordat | NA | NA | 2019 | 2019 | 100 | 15 | https://www.ncbi.nlm.nih.gov/pmc/articles/PMC8548324/ |
| Africa | Eritrea | Gash Barka | Shambuko | NA | NA | 2019 | 2019 | 100 | 10 | https://www.ncbi.nlm.nih.gov/pmc/articles/PMC8548324/ |
| Africa | Eritrea | Gash Barka | Tesseney | NA | NA | 2019 | 2019 | 105 | 1 | https://www.ncbi.nlm.nih.gov/pmc/articles/PMC8548324/ |
| Africa | Eritrea | Gash Barka | Tokombia | NA | NA | 2019 | 2019 | 106 | 6 | https://www.ncbi.nlm.nih.gov/pmc/articles/PMC8548324/ |
| Africa | Eritrea | Gash Barka | Barentu | NA | NA | 2019 | 2019 | 101 | 1 | https://www.ncbi.nlm.nih.gov/pmc/articles/PMC8548324/ |
2. Estimating the ICC
We can estimate the ICC using the Bayesian model in DRpower
by running the get_ICC() function on each of the 7 domains
We will assume a completely flat prior on the ICC by setting
prior_ICC_shape1 = 1 and prior_ICC_shape2 = 1,
and we will return the full posterior distribution by setting
post_full_on = TRUE.
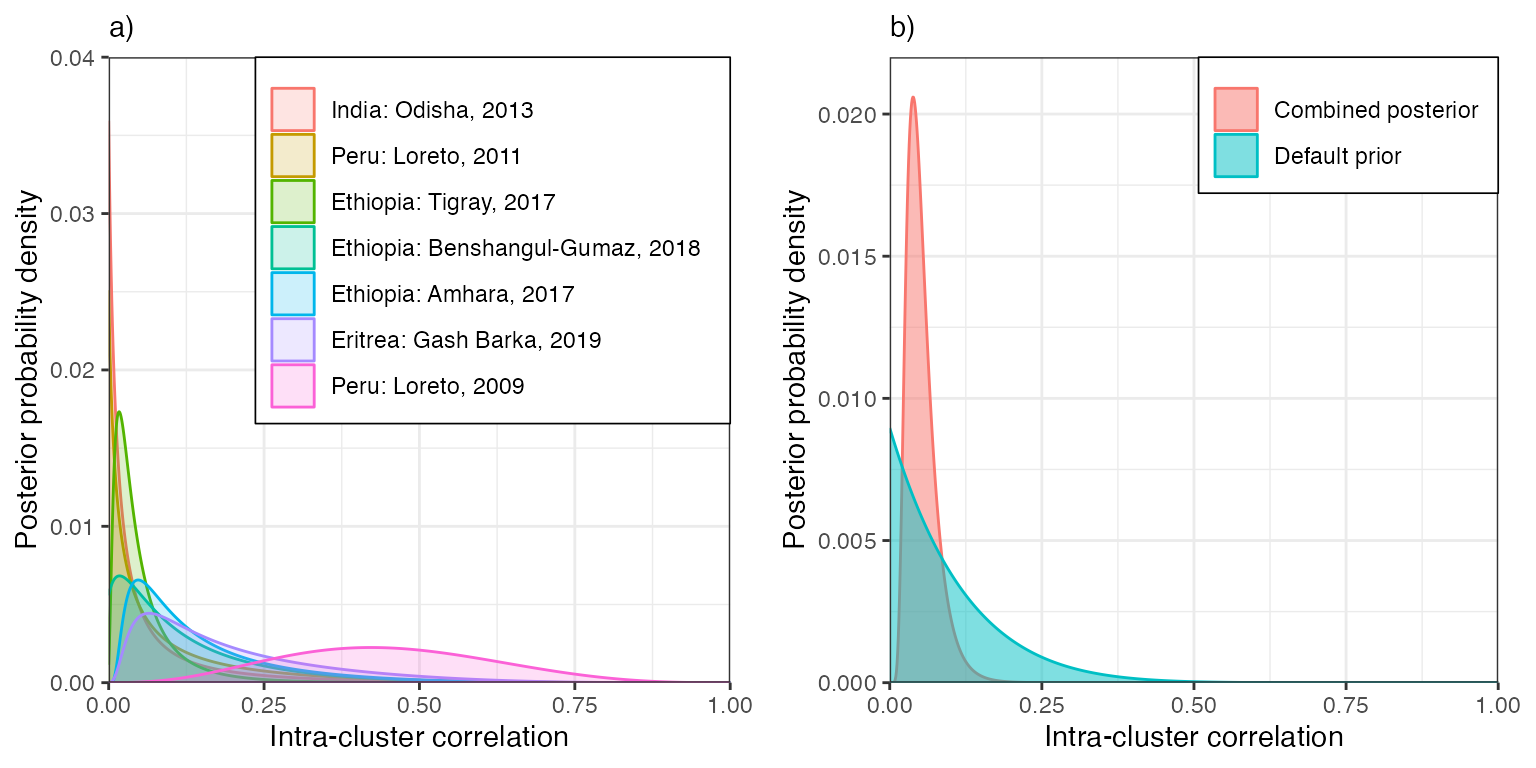
We can see that there is limited information on the ICC, as evidenced by the relatively spread out posteriors. That being said, most studies agree that it is greater than 0 and less than around 0.3, the exception being Loreto region of Peru in 2009, which suggests higher values but is also extremely vague due to small sample sizes.
We can combine information over sites by multiplying together these
posteriors. The result is shown in panel b), and is much sharper,
peaking at ICC = 0.038 and entertaining values up to around 0.1.
However, combining posteriors in this way makes the hard assumption that
there is a single ICC that is the same everywhere in the world, which
may not be true for different populations and geographic regions. For
this reason, we take a more practical approach when defining priors; we
manually define the prior on ICC to be consistent with historical data
while also capturing the plausible range between studies. We opt for a
Beta(1, 9) distribution, which is also shown in panel b). This
distribution allows for ICC values anywhere in the plausible range from
0 to 0.3, while at the same time putting very low probability on values
greater than this. This prior is adopted as the default in all
DRpower functions, and can be overwritten by setting
prior_ICC_shape1 and prior_ICC_shape2
manually.
The second place we need to know the ICC is when estimating power. In our simulation approach, we are forced to simulate data under an assumed ICC value. Based on the information above, we focus on the case of ICC = 0.05 as a realistic value that is likely to hold true for most studies. However, if the aim is to be cautious about the ICC then one can opt for a larger value, which will in turn lead to larger sample sizes.