These two functions run get_prevalence() and
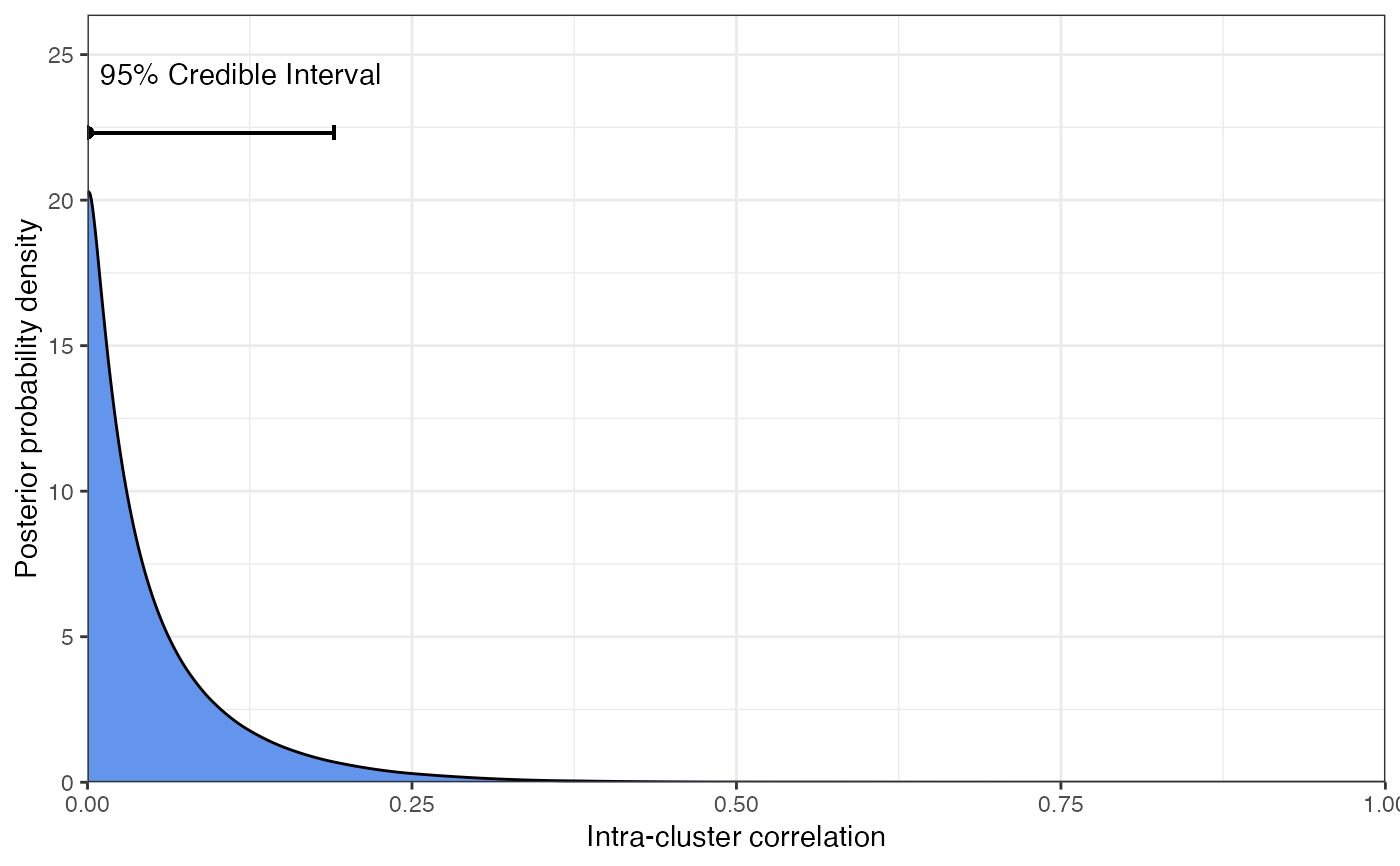
get_ICC() respectively to obtain the full posterior distribution of
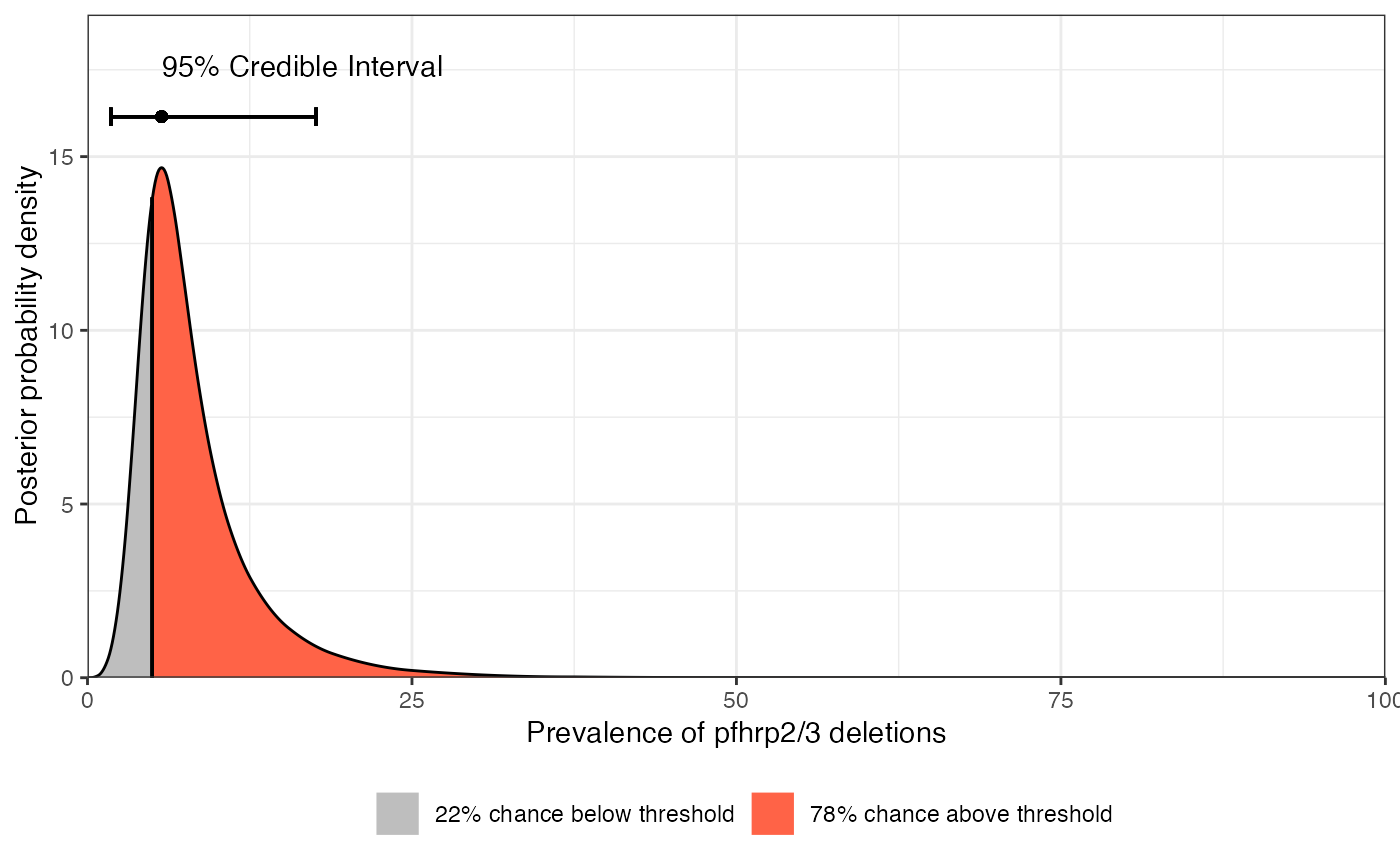
the parameter of interest. Then they plot the posterior density along with
some useful visualisations including the 95
plot_prevalence(
  n,
  N,
  prev_range = c(0, 1),
  alpha = 0.05,
  prev_thresh = 0.05,
  prior_prev_shape1 = 1,
  prior_prev_shape2 = 1,
  prior_ICC_shape1 = 1,
  prior_ICC_shape2 = 9,
  CrI_type = "HDI",
  n_intervals = 20,
  use_cpp = TRUE
)

plot_ICC(
  n,
  N,
  ICC_range = c(0, 1),
  alpha = 0.05,
  prev_thresh = 0.05,
  prior_prev_shape1 = 1,
  prior_prev_shape2 = 1,
  prior_ICC_shape1 = 1,
  prior_ICC_shape2 = 9,
  CrI_type = "HDI",
  n_intervals = 20,
  use_cpp = TRUE
)
Arguments
- n, N
the numerator (
n) and denominator (N) per cluster. These are both integer vectors.- prev_range
the range of prevalence values explored. Vector of two values giving lower and upper limits, defined between 0 and 1.
- alpha
the significance level of the credible interval - for example, use
alpha = 0.05for a 95% interval. See alsoCrI_typeargument for how this is calculated.- prev_thresh
the prevalence threshold that we are testing against (single value only, proportion between 0 and 1).
- prior_prev_shape1, prior_prev_shape2, prior_ICC_shape1, prior_ICC_shape2
parameters that dictate the shape of the Beta priors on prevalence and the ICC. See the Wikipedia page on the Beta distribution for more detail. The default values of these parameters were chosen based on an analysis of historical pfhrp2/3 studies, although this does not guarantee that they will be suitable in all settings.
- CrI_type
which method to use when computing credible intervals. Options are "ETI" (equal-tailed interval) or "HDI" (high-density interval). The ETI searches a distance
alpha/2from either side of the [0,1] interval. The HDI method returns the narrowest interval that subtends a proportion1-alphaof the distribution. The HDI method is used by default as it guarantees that the MAP estimate is within the credible interval, which is not always the case for the ETI.- n_intervals
the number of intervals used in the adaptive quadrature method. Increasing this value gives a more accurate representation of the true posterior, but comes at the cost of reduced speed.
- use_cpp
if
TRUE(the default) then use an Rcpp implementation of the adaptive quadrature approach that is much faster than the base R method.- ICC_range
the range of ICC values explored. Vector of two values giving lower and upper limits, defined between 0 and 1.