Nimue rewrite: Booster Pathway
booster_pathway.RmdThis vignette describes the rewritten nimue booster pathway. This update allows the inclusion of booster doses to vaccination campaigns in the nimue model and allows explicit inclusion of first and second dose efficacies. No changes are made to the infection and hospitalisation pathway.
Model Structure
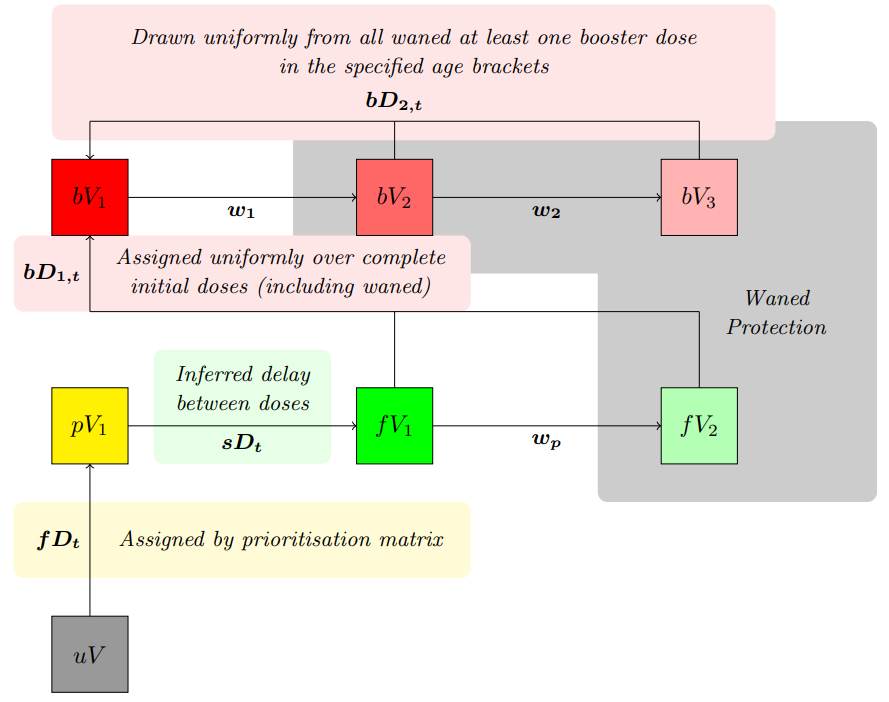
Compartment definitions are as follows:
- \(uV\) Un-vaccinated population,
- \(pV_i\) Partially vaccinated/protected population (i.e. first dose of a two dose regimen),
- \(fV_i\) Fully vaccinated/protected population (i.e. both doses of a two dose regimen).
- \(bV_i\) Boosted population (at least one booster dose).
Full dose and boosted compartments both feed into waned compartments that represent reduced vaccine efficacy over time. Transition rates are defined as:
- \(fD_t\) Daily time-series of first doses,
- \(sD_t\) An inferred delay between doses (~60 days),
- \(bD_{1,t}\) Daily time-series of initial booster doses,
- \(bD_{2,t}\) Daily time-series of follow-up booster doses, can be limited to certain age groups,
- \(w_p\) Rate of waning of initial dose protection,
- \(w_i\) Rate of waning of boosted dose protection.
Eligibility for follow-up boosters can be restricted to certain age groups with the parameter vaccine_booster_follow_up_coverage.
Usage
The user is expected to provide a time-series of primary doses, and booster doses. This model is primarily for usage in the global_lmic_reports, and so it not intended for normal usage. The objects necessary for MCMC fitting can be access as so:
#model object
squire.page::nimue_booster_model()
#likelihood function
squire.page::calc_loglikelihood_booster()
#pmcmc object
squire.page::pmcmc_drjacoby(log_likelihood = squire.page::calc_loglikelihood_booster,
                            nimue_booster_model = squire.page::nimue_booster_model,
                            ... #specific arguments here
                            )
#alternatively
rt_optimise(squire_model = squire.page::nimue_booster_model(),
            ... #Parameter arguments here
            )
The model can be run as in squire or nimue with the non-exported function squire.page:::run_booster.
squire.page:::run_booster(
  country = "United Kingdom",
  primary_doses = c(100, 1000, 500, 0),
  tt_primary_doses = c(0, 10, 50, 150),
  second_dose_delay = 60,
  booster_doses = c(0, 500, 750),
  tt_booster_doses = c(0, 200, 400),
  time_period  = 365*2,
  vaccine_booster_follow_up_coverage = c(rep(0, 17 - 5), rep(1, 5))
) %>%
  squire.page::nimue_format(var_select = c("vaccinated_first_dose", "vaccinated_second_dose", "vaccinated_second_waned",
                                           "vaccinated_booster_dose", "vaccinated_booster_waned")) %>%
  tibble() %>%
  pivot_wider(names_from = compartment, values_from = y) %>%
  transmute(
    t = t,
    `Partial` = vaccinated_first_dose - vaccinated_second_dose,
    `Primary` = vaccinated_second_dose - vaccinated_booster_dose - vaccinated_second_waned,
    `Waned (Primary)` = vaccinated_second_waned,
    `Boosted` = vaccinated_booster_dose - vaccinated_booster_waned,
    `Waned (Boosted)` = vaccinated_booster_waned
  ) %>%
  pivot_longer(c(`Partial`, `Primary`,
    `Waned (Primary)`,
    `Boosted`,
    `Waned (Boosted)`),
               names_to = "Vaccine Protection", values_to = "Population") %>%
  ggplot(aes(x = t, y = `Population`, colour = `Vaccine Protection`)) +
  geom_line()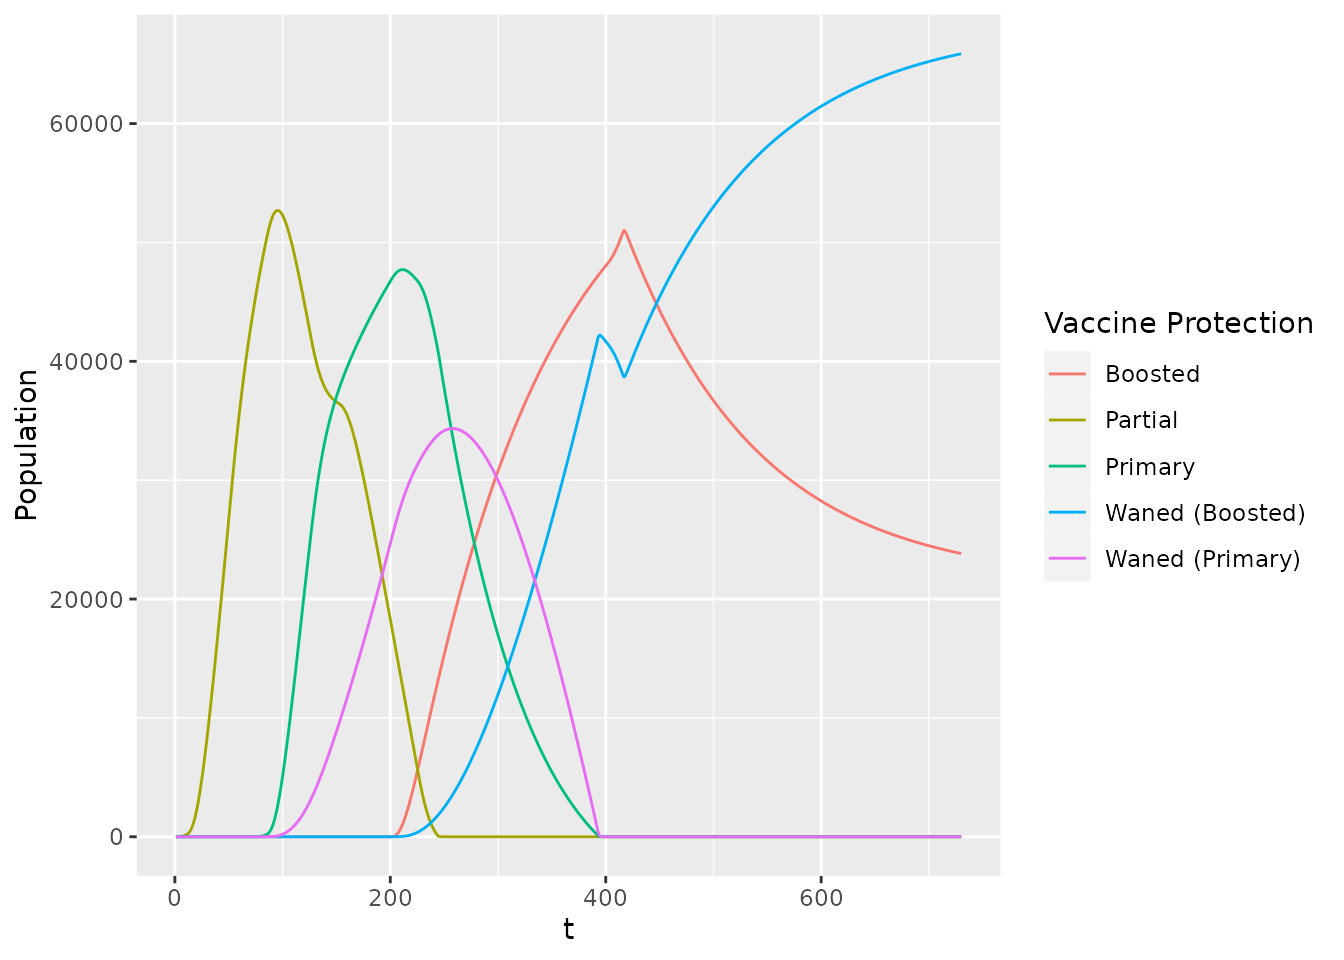
As the delay in development of vaccination protection from nimue is removed, the time-series for first/second doses provided to the model if internally adjusted via an Erlang distribution with shape 2 and rate 1/7 to simulate this effect. These parameters are customizable in the model.
To simulate a primary single dose vaccine (i.e. Janssen) set both first and second dose efficacies to the same desired level and set the second dose delay to 1.
Parameterisation
Default parameter values are chosen to be representative for the vaccination programmes of LMIC and LIC countries and against the wild-type variant and as such represent no single vaccine but are chosen from a range of values to represent roughly the Adenovirus, Whole Virus, and Subunit vaccines. Note that for work involving these efficacies against Delta and Omicron are calculated elsewhere.
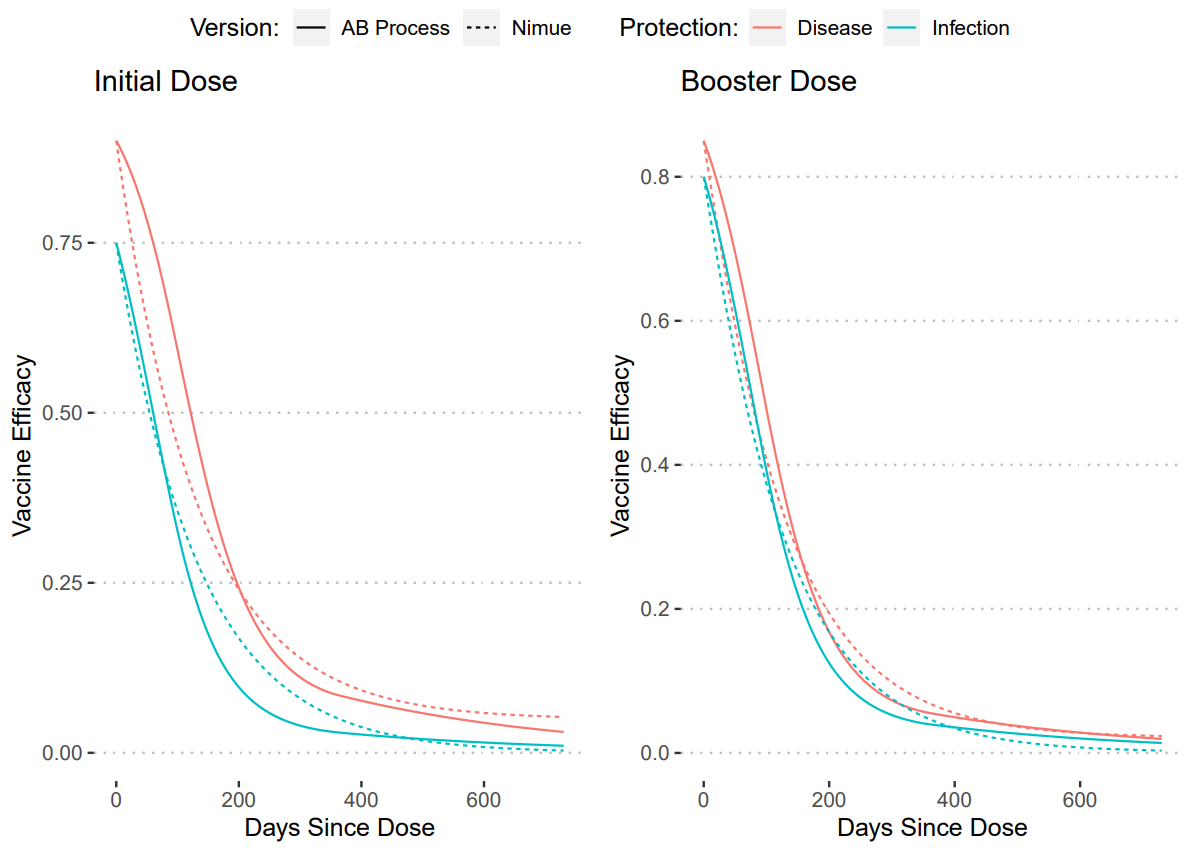
Vaccine Efficacies:
Waning Rates:
- \(w_p\) = 0.007466205 (134 days)
- \(w_1\) = 0.00807429 (123.8 days)
- \(w_2\) = 0.03331390 (30 days)
Delay in second dose protection is assumed to be 60 days.
To calculate these values we utilised an approach taken previously with waning vaccine efficacy via AB titres (Report 48). We took our assumed non-waned efficacies and then created an median waning curve from these values. Then we fit the waning rates and waned compartment values to recreate these curves. The plots of these fits are shown below.
Comparison to nimue
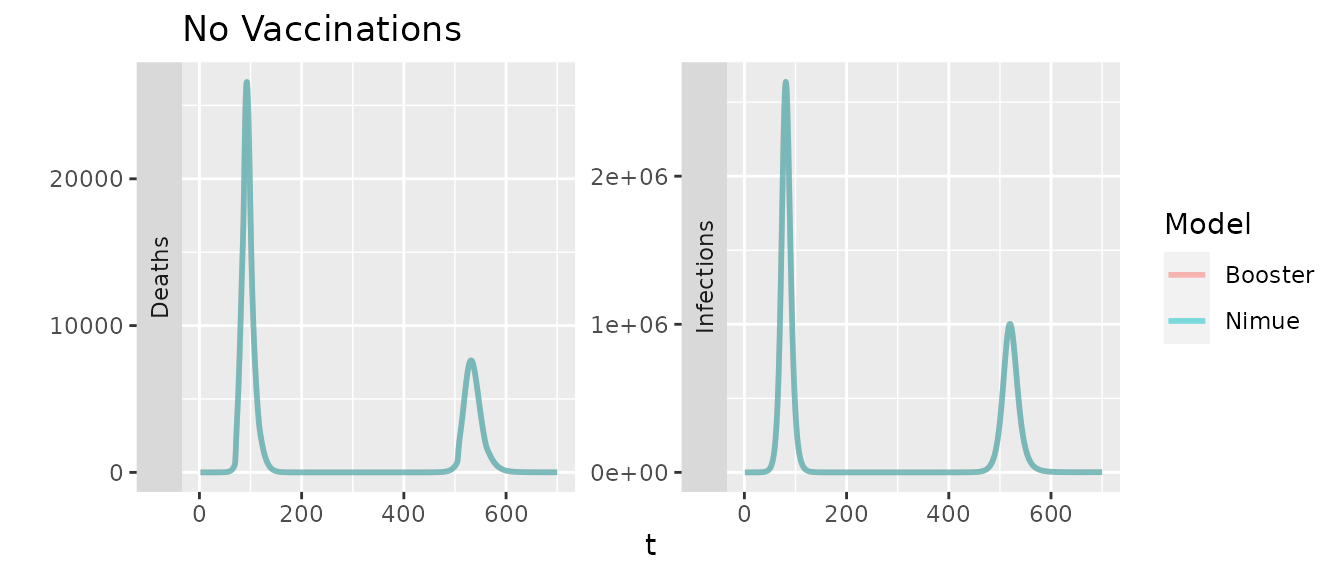
Comparing the two models in the absence of vaccinations should give identical results, outside of minor variations due to the random ages of the initial infections.
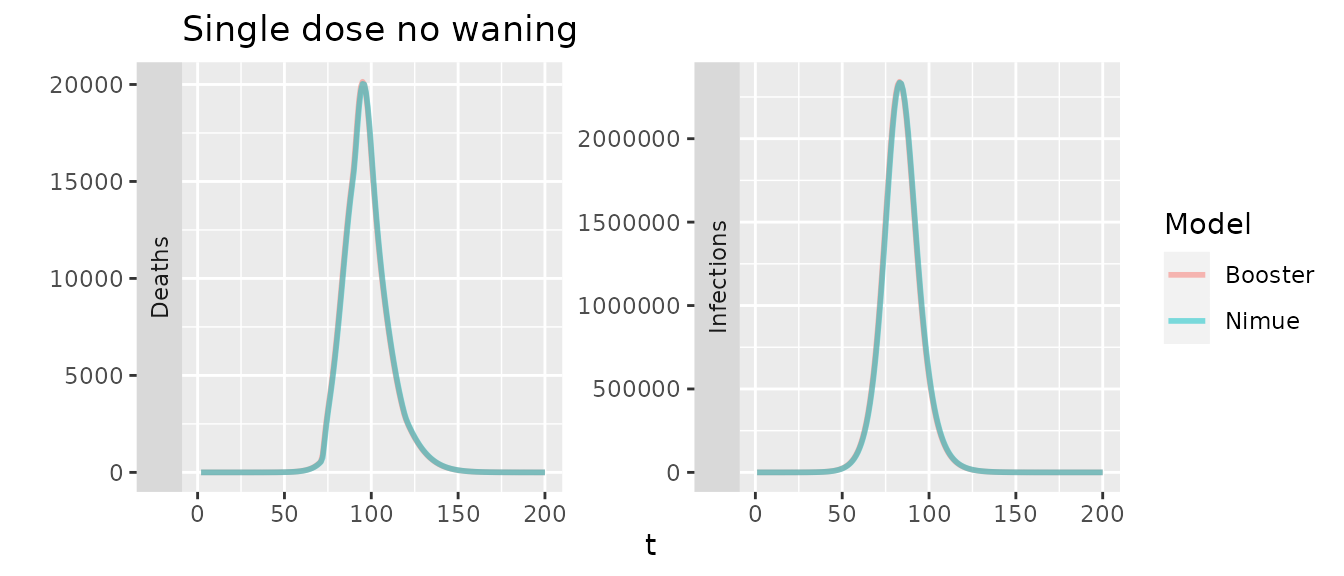
Comparing the two models with only primary doses (with a flat efficacy for first/second) and no waning should also be identical
With waning we would expect to see some minor difference as the booster only has a single compartment to represent primary dose waning, though with the same overall rates they should be similar.
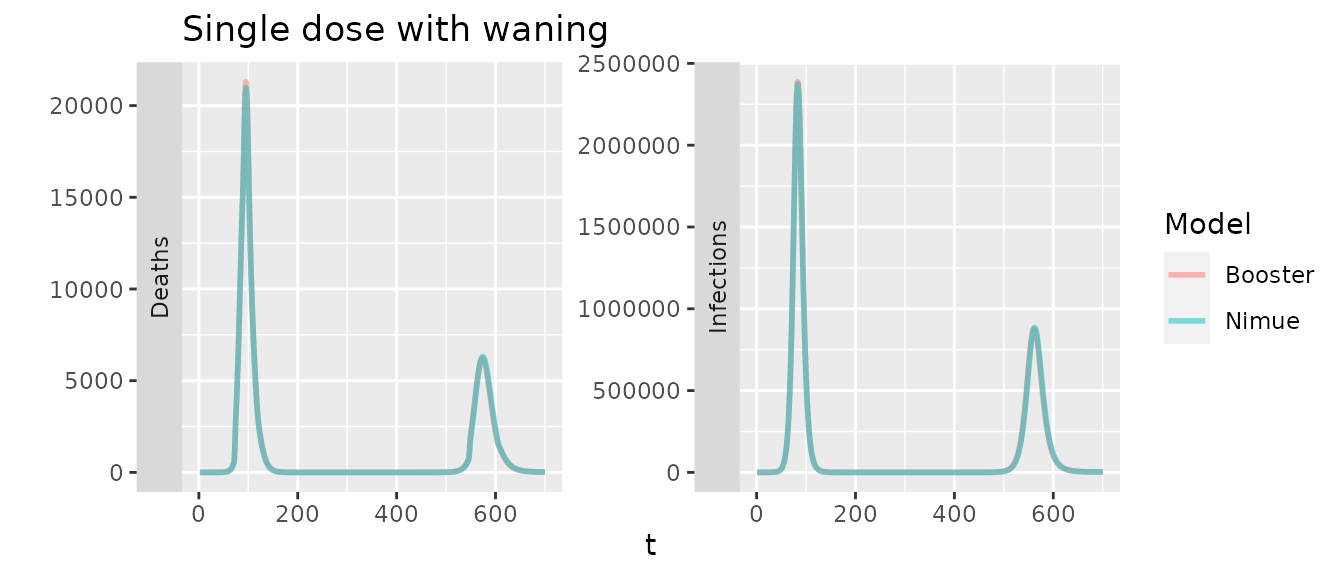
In the plot above we increase the duration of waning in nimue by 14 days to account for the fact that in the booster model the 14 day delay in developing VE is applied for both first and second doses. Otherwise the second peak occurs a couple of days sooner in nimue.
To simulate two doses we first consider the situation with a delay of 60 days between the two, for nimue this is translated into a dose ratio and the VE are scaled. Again for nimue we must increase the duration of protection to account for the delay between doses.
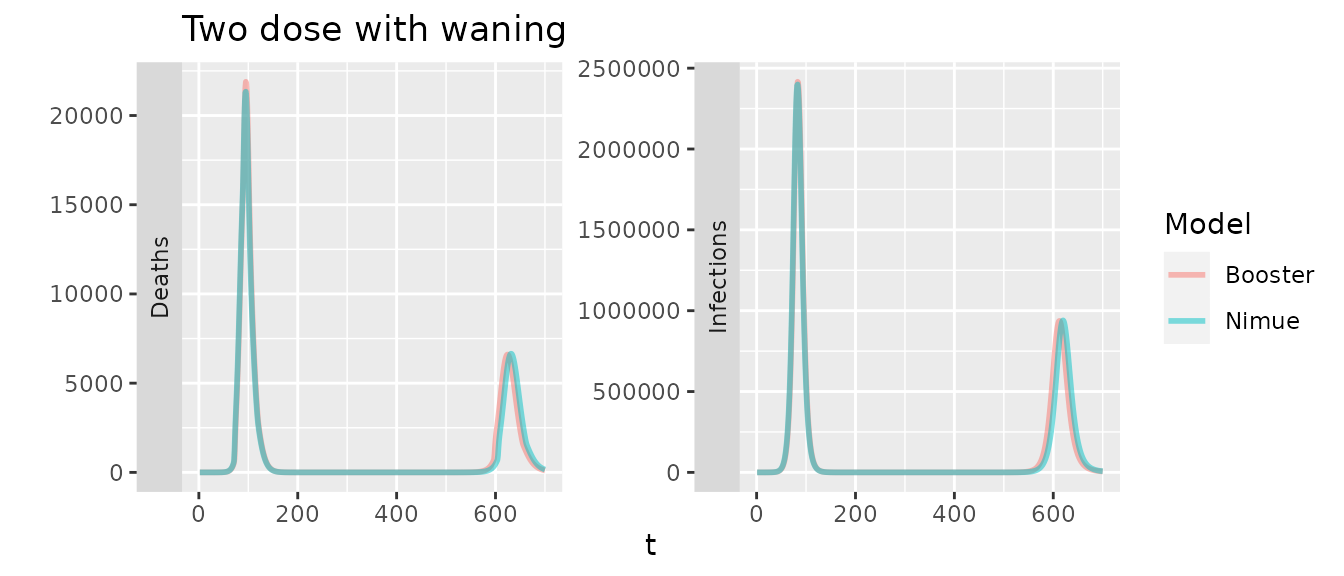
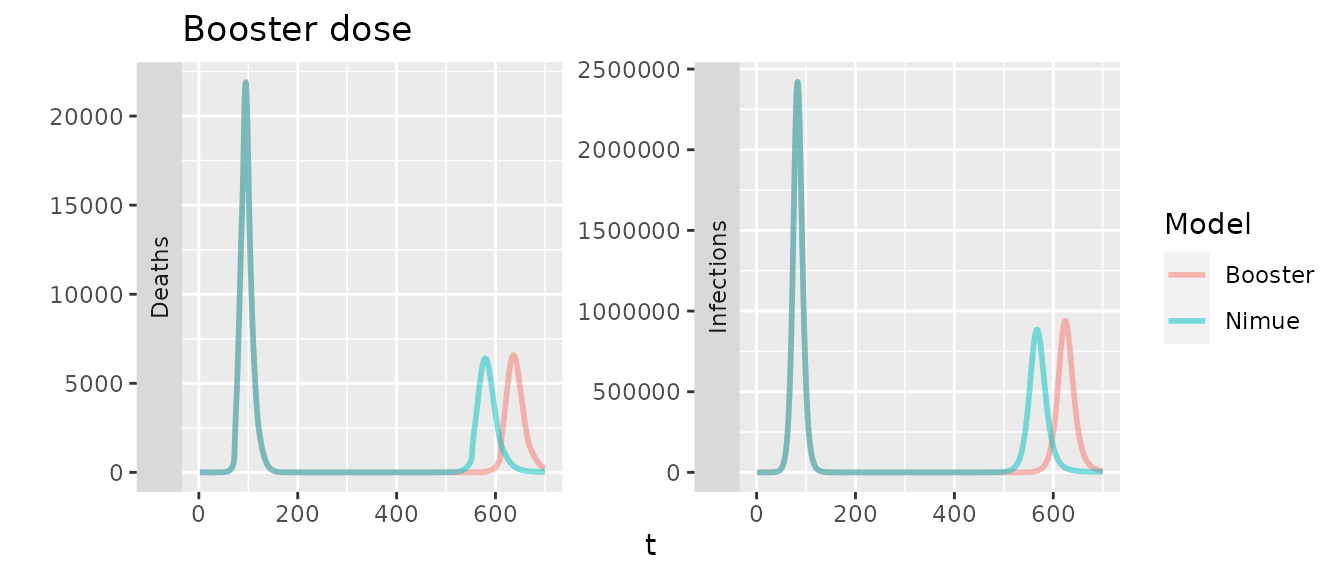
Lastly including boosters in the booster model, we would expect a delay in deaths until waning overwhelms.