skygrowth
Phylodynamic inference
skygrowth
Phylodynamic inference of effective population size for time-scaled phylogenies. Inference makes use of Bayesian Gibbs-within-Metropolis MCMC and fast maximum a posteriori algorithms. The growth rate of effective population size is modeled as a simple Brownian motion process.
This package includes functions for
- incorporating time-varying covariates into phylodynamic inference. This is appropriate if the covariate is expected to alter the growth rate of effective population size
- computing the reproduction number (expected number of offspring) through time given prior information about the generation interval
To cite
Erik Volz and Xavier Didelot, Modeling the growth and decline of pathogen effective population size provides insight into epidemic dynamics and drivers of antimicrobial resistance, Systematic Biology, 2018
H3N2 influenza in New York
This data set is provided in the phylodyn R package by Karcher et al. It is based on 12 consecutive seasonal influenza seasons in NY state up to 2004.
require(skygrowth)
require(ape)
require(ggplot2)
load(system.file( 'NY_flu.rda', package='skygrowth')  )
(tr <- NY_flu) # NOTE branch lengths in weeks  / 13 years in all
##
## Phylogenetic tree with 709 tips and 708 internal nodes.
##
## Tip labels:
## 	CY000001date568.3, CY000009date563.9, CY000017date565.7, CY000025date565.3, CY000033date571.0, CY000041date565.9, ...
##
## Rooted; includes branch lengths.
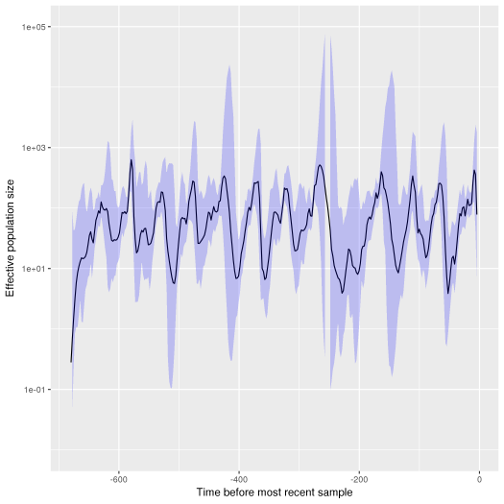
fit <- skygrowth.map( tr
 , res = 24*13  # Ne changes every 2 weeks
 , tau0 = .1    # Smoothing parameter. If prior is not specified, this will also set the scale of the prior
)
plot( fit )
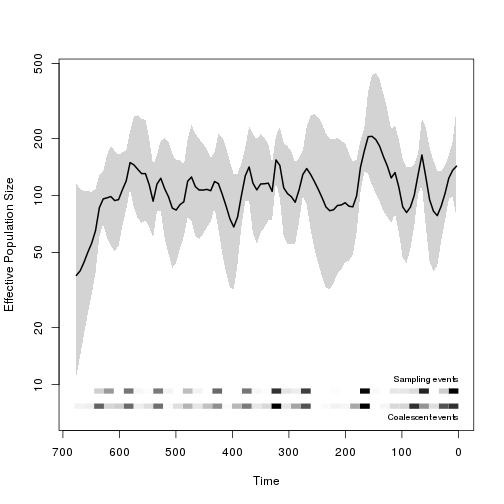
We can compare this to the standard skyride model:
require(phylodyn)
b0 <- BNPR( tr )
plot_BNPR( b0 )
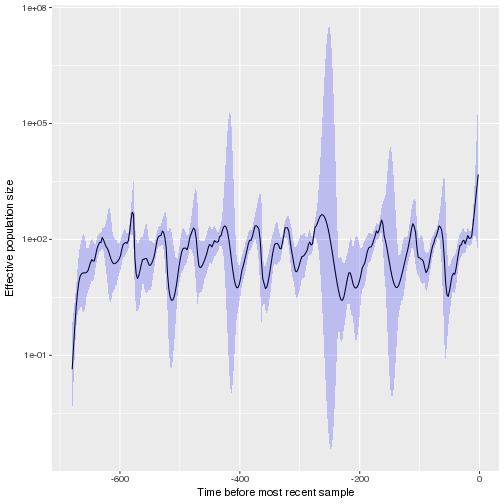
We can also run the slower MCMC version which should provide more accurate CIs:
mcmcfit <- skygrowth.mcmc( tr, res = 24*13, tau0=.1 )
plot( mcmcfit )  + scale_y_log10(limits=c(.01, 1e5))
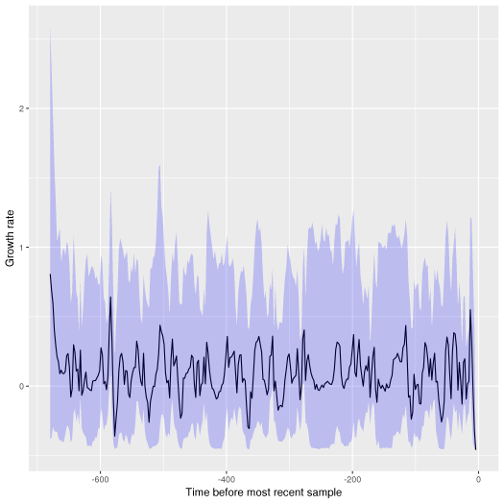
And we can visualise the growth rate through time:
growth.plot( mcmcfit )