Construct the beta (contact rate) over time array for use within
sircovid models.
sircovid_parameters_beta(date, value, dt)
Arguments
| date | Either |
|---|---|
| value | A vector of values to use for beta - either a scalar
(if |
| dt | The timestep that will be used in the simulation. This
must be of the form |
Value
Returns a vector of beta values, one per timestep, until the beta values stabilise. After this point beta is assumed to be constant.
See also
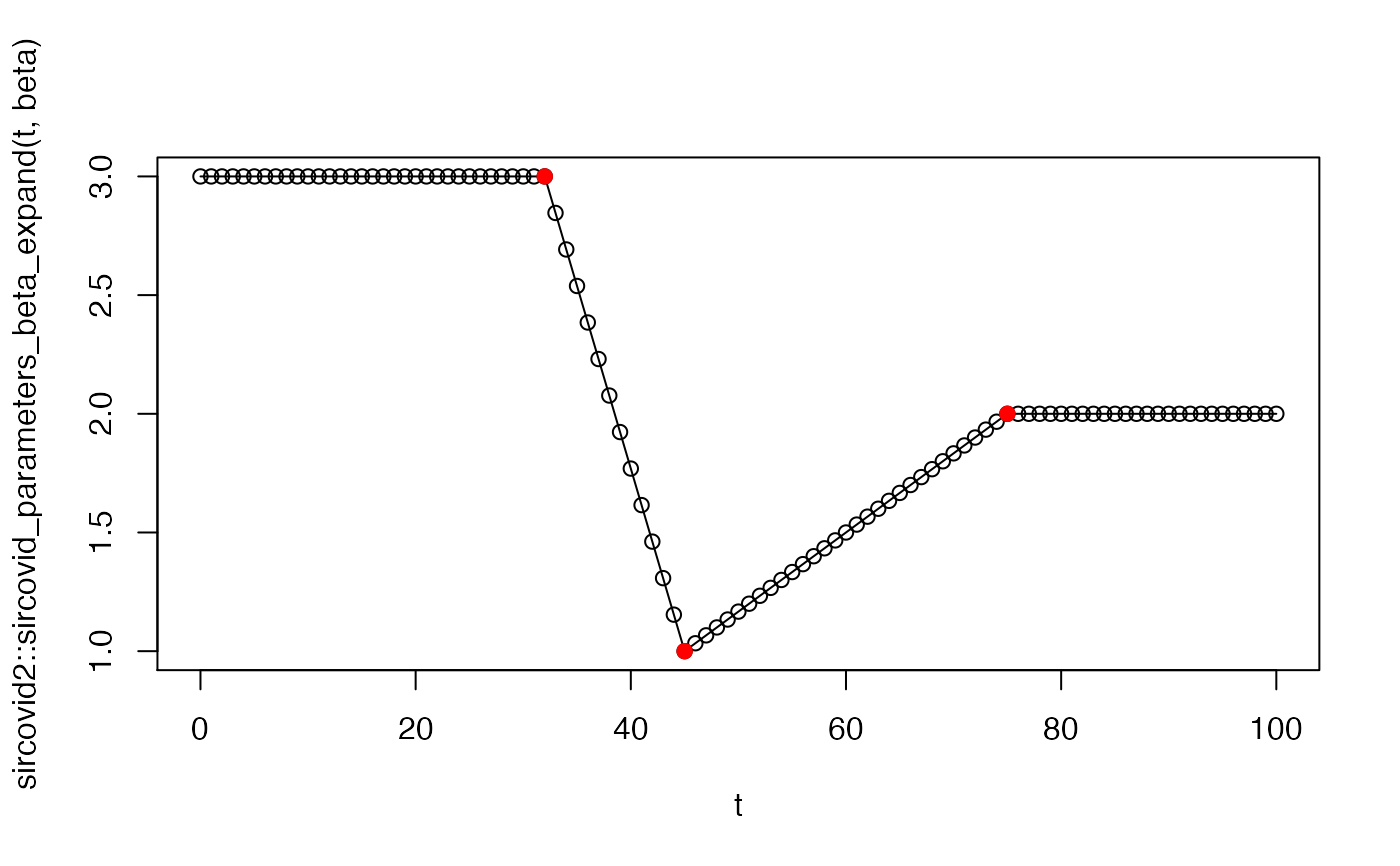
sircovid_parameters_beta_expand() - see examples below
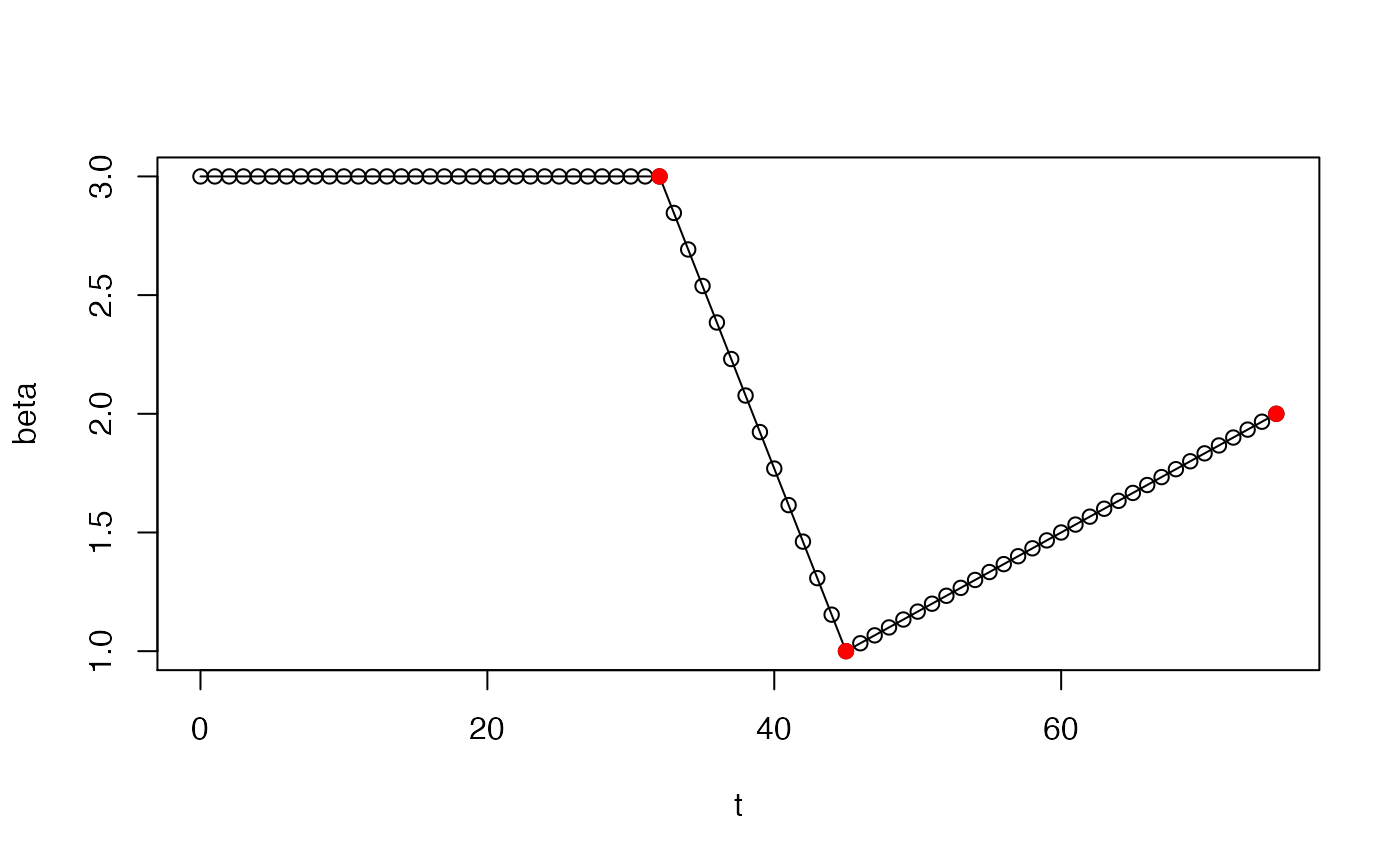
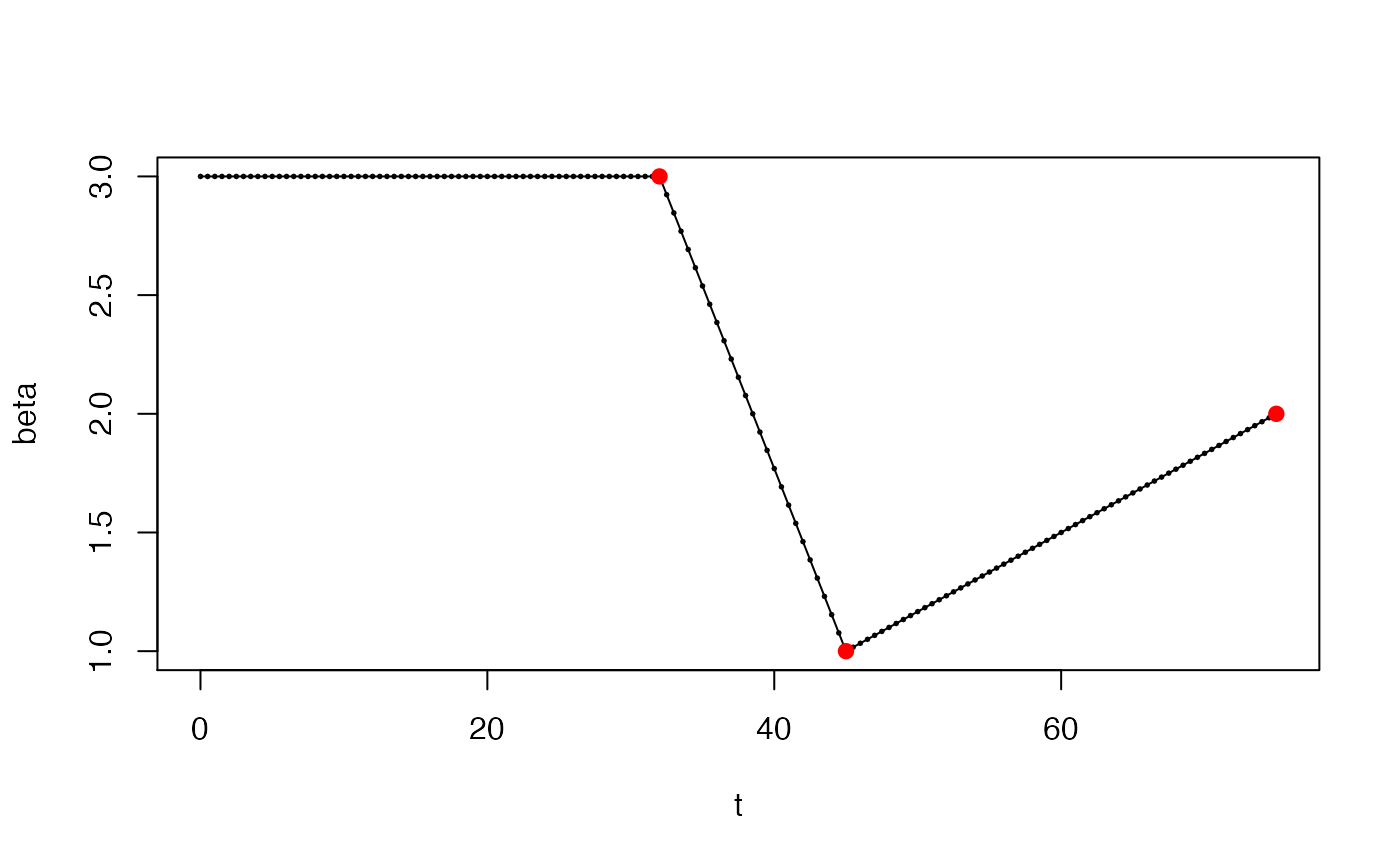
Examples
# If "date" is NULL, then beta is constant and this function is # trivial: sircovid2::sircovid_parameters_beta(NULL, 0.1, 0.25)#> [1] 0.1date <- sircovid2::sircovid_date( c("2020-02-01", "2020-02-14", "2020-03-15")) value <- c(3, 1, 2) beta <- sircovid2::sircovid_parameters_beta(date, value, 1) # The implied time series looks like this: t <- seq(0, date[[3]]) plot(t, beta, type = "o")# After 2020-03-15, the beta value will be fixed at 2, the value # that it reached at that date. # You can see this using sircovid_parameters_beta_expand # If a vector of dates is provided then, it's more complex. We'll # use dt of 1 here as it's easier to visualise t <- seq(0, 100, by = 1) sircovid2::sircovid_parameters_beta_expand(t, beta)#> [1] 3.000000 3.000000 3.000000 3.000000 3.000000 3.000000 3.000000 3.000000 #> [9] 3.000000 3.000000 3.000000 3.000000 3.000000 3.000000 3.000000 3.000000 #> [17] 3.000000 3.000000 3.000000 3.000000 3.000000 3.000000 3.000000 3.000000 #> [25] 3.000000 3.000000 3.000000 3.000000 3.000000 3.000000 3.000000 3.000000 #> [33] 3.000000 2.846154 2.692308 2.538462 2.384615 2.230769 2.076923 1.923077 #> [41] 1.769231 1.615385 1.461538 1.307692 1.153846 1.000000 1.033333 1.066667 #> [49] 1.100000 1.133333 1.166667 1.200000 1.233333 1.266667 1.300000 1.333333 #> [57] 1.366667 1.400000 1.433333 1.466667 1.500000 1.533333 1.566667 1.600000 #> [65] 1.633333 1.666667 1.700000 1.733333 1.766667 1.800000 1.833333 1.866667 #> [73] 1.900000 1.933333 1.966667 2.000000 2.000000 2.000000 2.000000 2.000000 #> [81] 2.000000 2.000000 2.000000 2.000000 2.000000 2.000000 2.000000 2.000000 #> [89] 2.000000 2.000000 2.000000 2.000000 2.000000 2.000000 2.000000 2.000000 #> [97] 2.000000 2.000000 2.000000 2.000000 2.000000# If dt is less than 1, this is scaled, but the pattern of beta # change is the same beta <- sircovid2::sircovid_parameters_beta(date, value, 0.5) t <- seq(0, date[[3]], by = 0.5) plot(t, beta, type = "o", cex = 0.25)