Marburg Virus Disease (MVD)
Latest update: 2026-06-08
Source:vignettes/pathogen_marburg.Rmd
pathogen_marburg.RmdIn 2018, the World Health Organization (WHO) published a list of nine known pathogens (in addition to an unknown Pathogen X) for research and development (R&D) prioritisation, due to both their epidemic and pandemic potential and the absence of licensed vaccines or therapeutics. Among these prioritised pathogens is MVD, a highly-lethal infectious Filoviridae single-stranded RNA virus first described in Germany and Serbia (formerly Yugoslavia) in 1967. Subsequent outbreaks of this virus have primarily occurred in sub-Saharan Africa. The Pathogen Epidemiology Review Group (PERG) has published a systematic review for MVD, if you use any of our results please cite our paper:
@article{marburg_systematic_review_2023, title={{Marburg virus disease outbreaks, mathematical models, and disease parameters: a systematic review}}, author={Gina Cuomo-Dannenburg and Kelly McCain and Ruth McCabe and H Juliette T Unwin and Patrick Doohan and Rebecca K Nash and Joseph T Hicks and Kelly Charniga and Cyril Geismar and Ben Lambert and Dariya Nikitin and Janetta E Skarp and Jack Wardle and Pathogen Epidemiology Review Group and Mara Kont and Sangeeta Bhatia and Natsuko Imai and Sabine L van Elsland and Anne Cori and Christian Morgenstern}, journal={The Lancet Infectious Diseases}, year={2023}, doi={10.1016/S1473-3099(23)00515-7}, URL = {https://www.thelancet.com/journals/laninf/article/PIIS1473-3099(23)00515-7/fulltext}, publisher={Elsevier} }
All Tables and Figures from the paper are re-produced below on the latest available data in our data set. For convenience we label the Figures and Tables with the same numbers as in the paper.
Outbreaks
Table 1: Overview of MVD outbreaks i.e. location, timing, and size, as reported in the studies included in this review. We report in bold the country and outbreak year, the location refers to the place of the actual outbreak in the country if known. Blank cells correspond to information which we were unable to find in or extract from the literature.
Country |
Location |
Article |
Start |
End |
Deaths |
Confirmed |
Suspected |
Asymptomatic |
Severe/hospitalised |
Confirmation Method |
|---|---|---|---|---|---|---|---|---|---|---|
Angola |
Carroll2013 |
2005 |
2005 |
227 |
252 |
0 |
Not specified |
|||
Angola |
Palvin2014 |
2004 |
2005 |
227 |
252 |
|||||
Angola |
Uige Province |
Towner2006 |
Oct2004 |
Jul2005 |
227 |
252 |
0 |
|||
Democratic Republic of the Congo |
Durba and Watsa |
Borchert2002 |
Oct1998 |
May1999 |
61 |
73 |
0 |
Symptoms |
||
Democratic Republic of the Congo |
Durba and Watsa |
Bausch2006 |
Oct1998 |
Sep2000 |
125 |
48 |
106 |
0 |
Molecular |
|
Democratic Republic of the Congo |
Durba and Watsa villages |
Borchert2006 |
Oct1998 |
Aug2000 |
76 |
33 |
0 |
Molecular |
||
Democratic Republic of the Congo |
Palvin2014 |
1998 |
2000 |
128 |
154 |
|||||
Germany |
Marburg, Frankfurt am Main |
Albarino2013 |
18Aug1968 |
13Nov1968 |
5 |
23 |
1 |
Symptoms |
||
Germany,Yugoslavia |
Marburg (23), Frankfurt am Main (6), Belgrade (2) |
Martini1973 |
Aug1968 |
Nov1968 |
7 |
31 |
1 |
Symptoms |
||
Germany,Yugoslavia |
Pavlin2014 |
1967 |
7 |
31 |
||||||
Kenya |
Pavlin2014 |
1980 |
1 |
2 |
||||||
Kenya |
Pavlin2014 |
1987 |
1 |
1 |
||||||
Netherlands |
Pavlin2014 |
2008 |
1 |
1 |
||||||
Russian Federation |
Pavlin2014 |
1988 |
1 |
1 |
||||||
Russian Federation |
Pavlin2014 |
1990 |
0 |
1 |
||||||
South Africa,Zimbabwe |
Johannesburg |
Conrad1978 |
12Feb1975 |
1 |
3 |
1 |
Molecular |
|||
Uganda |
Kamwenge and Ibanda |
Adjemian2011 |
10Jun2007 |
14Sep2007 |
1 |
4 |
0 |
Molecular |
||
Uganda |
Kabale; Ibanda; Mbarara; Kampala |
Albarino2013 |
18Oct2012 |
7Nov2012 |
4 |
15 |
Molecular |
|||
Uganda |
Ibanda, Kabale and Kamwenge Districts |
Knust2015 |
Jul2012 |
10Nov2012 |
15 |
15 |
11 |
Molecular |
||
Uganda |
Ibanda and Kabale |
Mbonye2012 |
Sep2012 |
13Nov2012 |
7 |
9 |
5 |
Molecular |
||
Uganda |
Kampala |
Nyakarahuka2017 |
17Sep2014 |
28Sep2014 |
1 |
1 |
1 |
Molecular |
||
Uganda |
Pavlin2014 |
2007 |
2 |
4 |
||||||
United States |
Colorado |
Pavlin2014 |
2008 |
0 |
1 |
Parameters
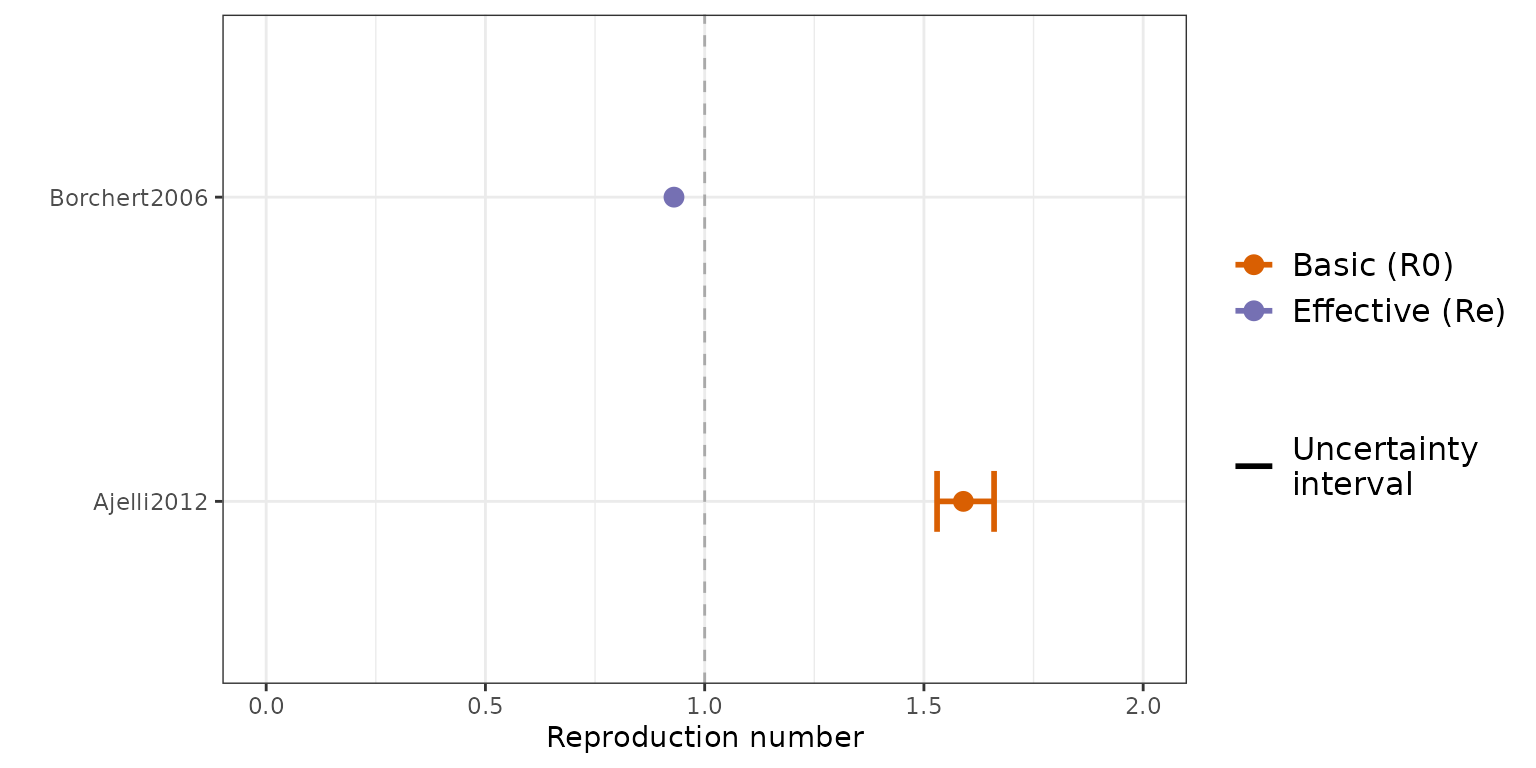
Reproduction numbers
Figure 3 (A): Estimates of the reproduction number. The blue and red points correspond to estimates of the effective reproduction number (Re) and basic reproduction number (R0) respectively, with associated uncertainty shown by the solid lines where available. The dashed vertical line presents the threshold for epidemic growth.
Severity
Figure 2 (A): Case Fatality Ratio (CFR) meta-analyses, using logit-transformed proportions and a generalized linear mixed-effects model (full details in SI A.4 in the paper). The forest plot displays studies includedin each meta-analyis: the red squares indicate study weight, and for each study, a 95% binomial confidence interval is provided. As summaries we display the total common effects, where all data are effectively pooled and assumed to come from a single data-generating process with one common CFR and total random effect estimates, which allow the CFR to vary by study and accordingly give different weights to each study when determining an overall estimate [19]. CFR estimates reported in the included studies.
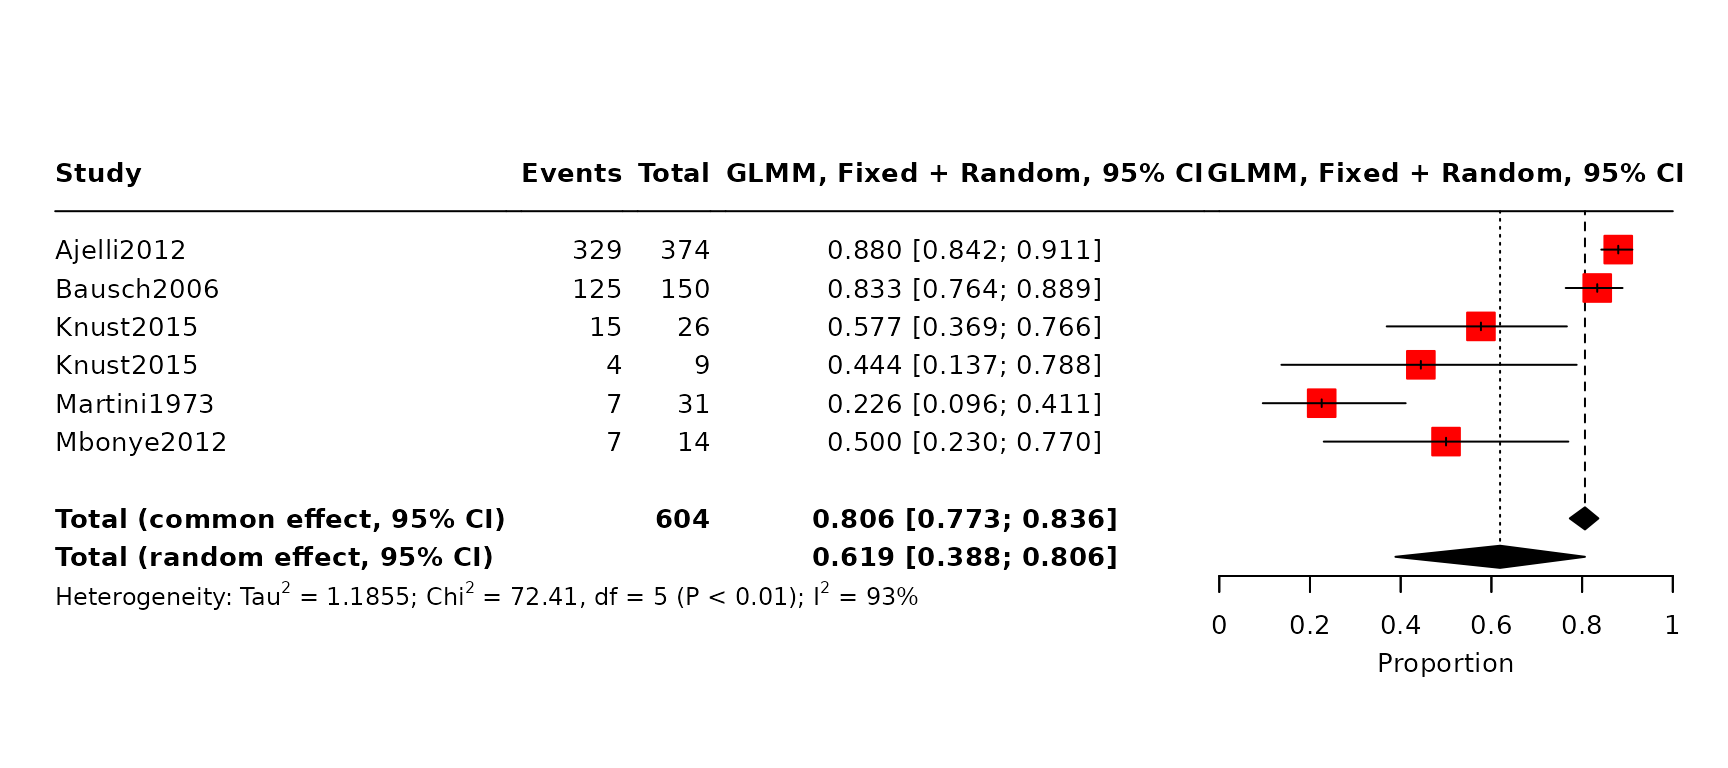
Figure 2 (B): CFR estimated from extracted outbreak data, including only one observation per outbreak using the study with the longest duration of the outbreak reported ensuring no case is double counted.
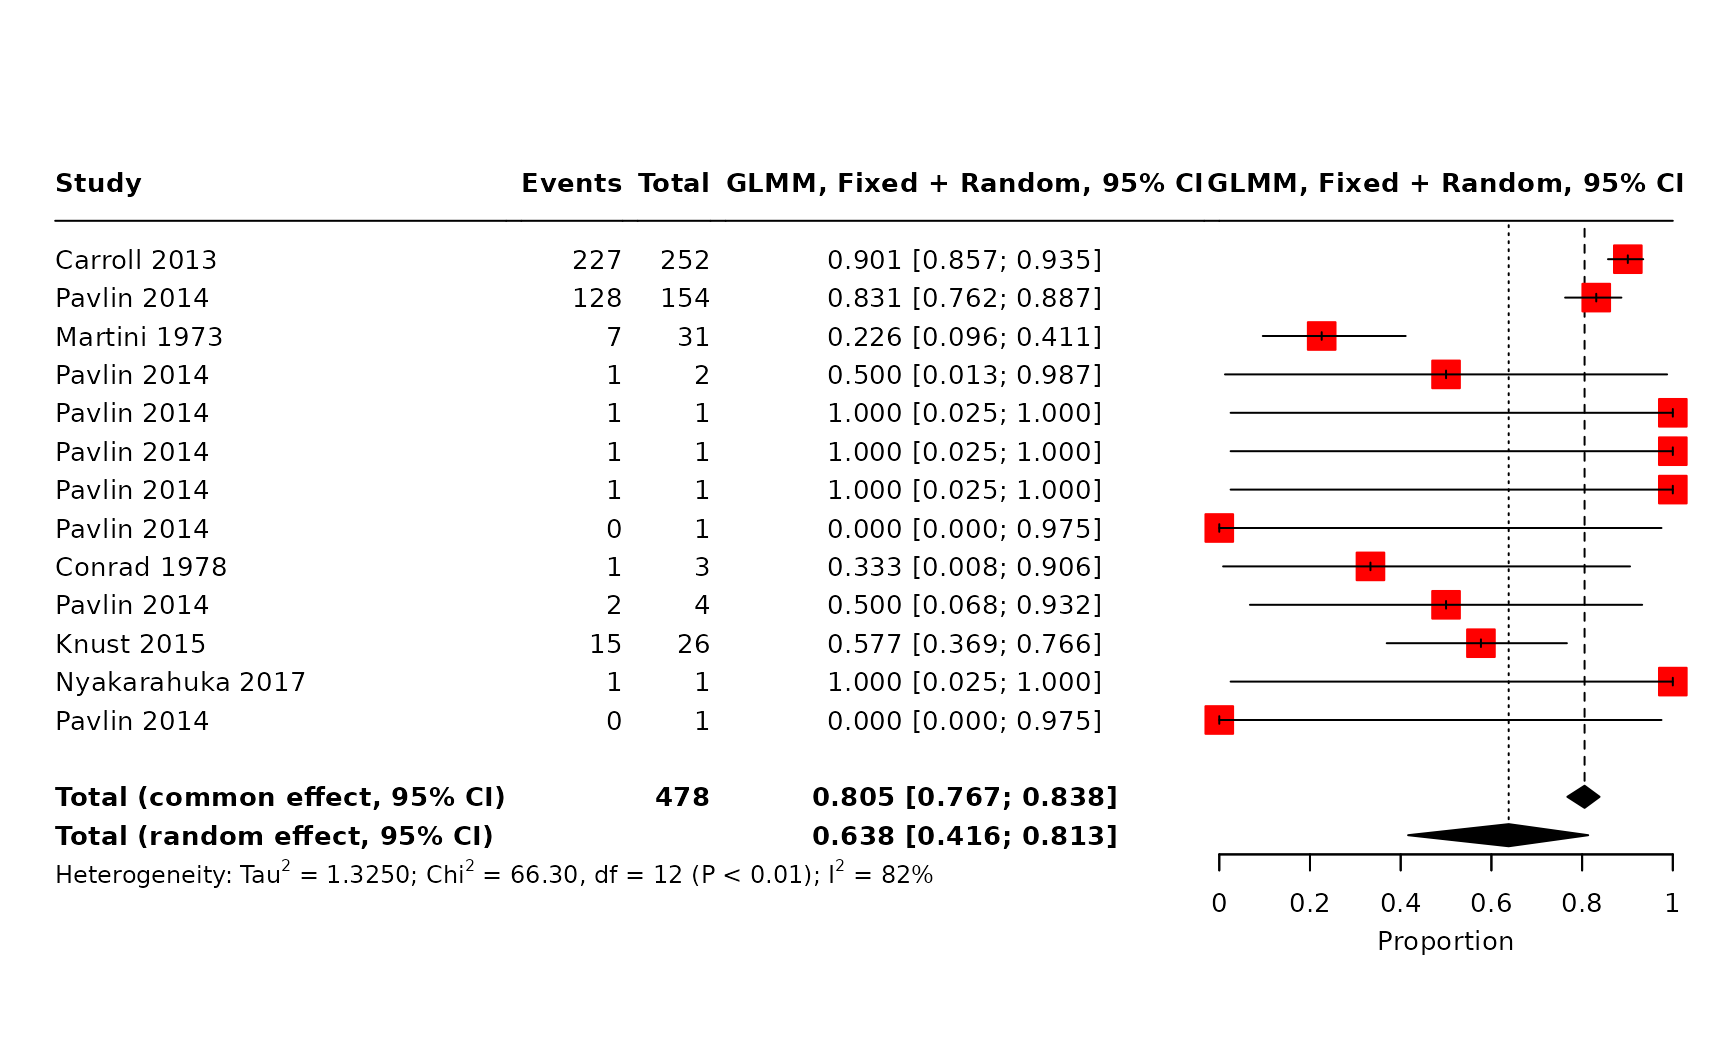
Figure S2 (A): Overview of the estimates of the case fatality ratio (CFR) obtained from the included studies. CFR estimates reported in the included studies, stratified according to estimation method. Points represent central estimates. Error bars represent an uncertainty interval associated with the point estimate, as reported in the original study.
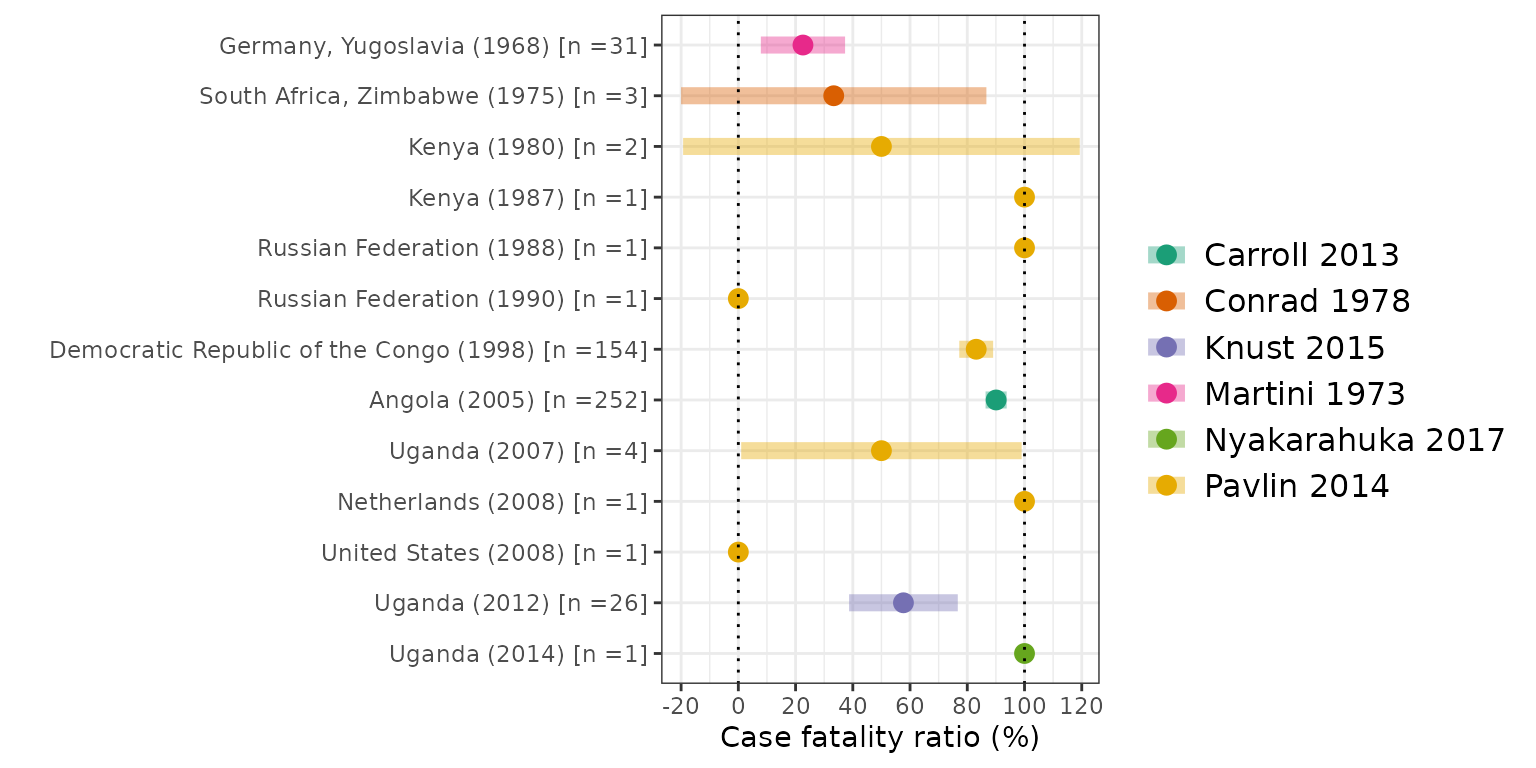
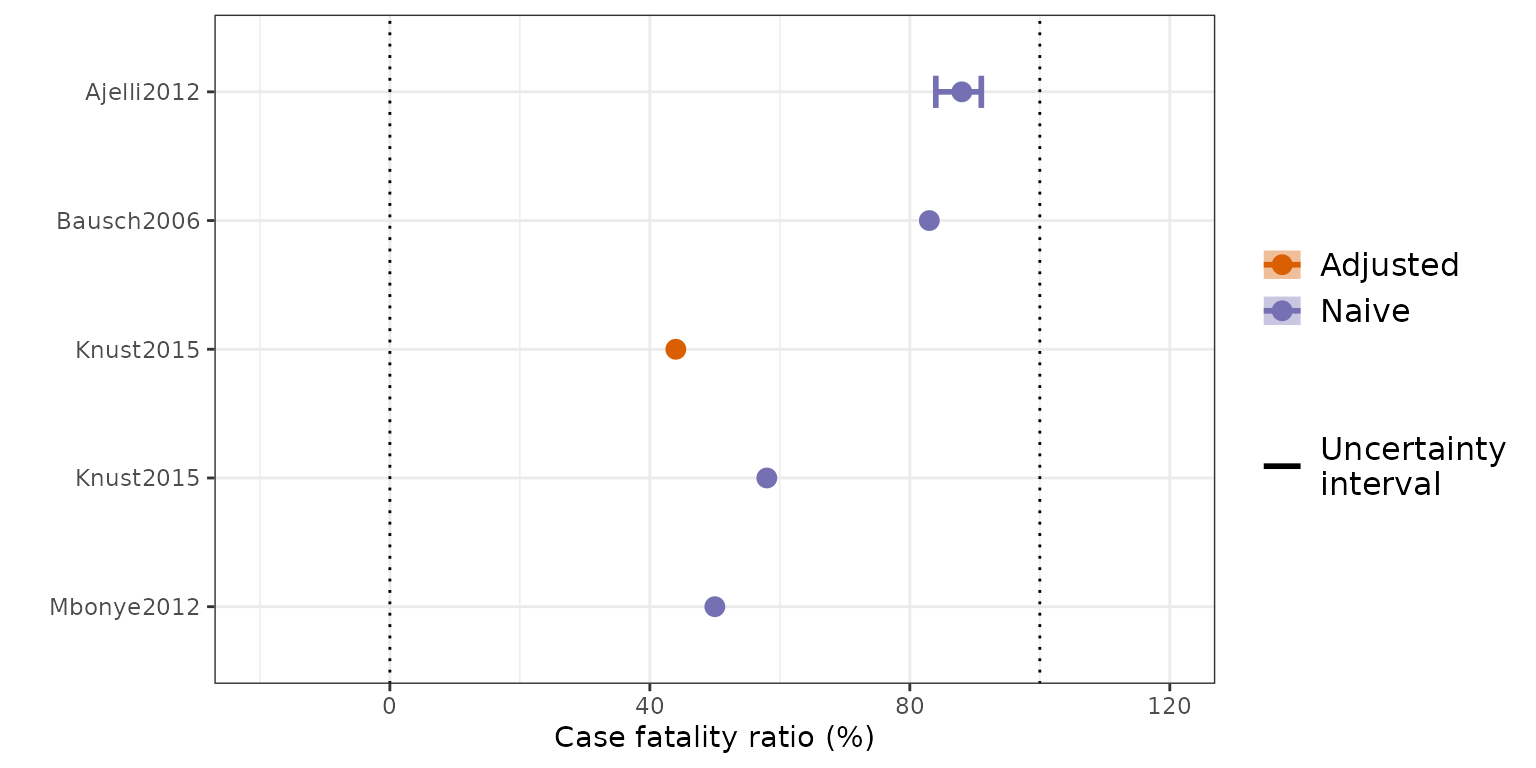 Figure S2 (B): Overview of the estimates of the case
fatality ratio (CFR) obtained from the included studies. CFR estimated
from extracted outbreak data, including only one observation per
outbreak using the study with the longest duration of the outbreak
reported ensuring each case is not double counted. Shaded bars
represents the imputed Binomial confidence interval for studies with a
sample size, n > 1. Vertical dotted lines represent 0% and 100% CFR.
Figure S2 (B): Overview of the estimates of the case
fatality ratio (CFR) obtained from the included studies. CFR estimated
from extracted outbreak data, including only one observation per
outbreak using the study with the longest duration of the outbreak
reported ensuring each case is not double counted. Shaded bars
represents the imputed Binomial confidence interval for studies with a
sample size, n > 1. Vertical dotted lines represent 0% and 100% CFR.
Delays
Table 2: Overview of the delay parameter estimates extracted from the included studies. These are stratified into five categories: Generation Time, Incubation Period, Time in Care, Time from Symptom to Careseeking and Time from Symptom to Outcome. Estimates and associated uncertainty are provided, along with information regarding the population group corresponding to the estimate and the timing and location of the outbreak. ‘Other’ refers to a range of different values which are specified in the underlying papers.
Article |
Country |
Parameter type |
Delays (days) |
Statistic |
Uncertainty type |
Population Group |
Timing of survey |
Outcome |
||
|---|---|---|---|---|---|---|---|---|---|---|
Ajelli2012 |
Angola |
Generation Time |
9.0 |
Mean |
CI95% |
General population |
Mid outbreak |
|||
Ajelli2012 |
Angola |
Generation Time |
5.4 |
Standard Deviation |
CI95% |
General population |
Mid outbreak |
|||
Ajelli2012 |
Angola |
Generation Time |
9.3 |
Mean |
CI95% |
General population |
Mid outbreak |
|||
Martini1973 |
Germany,Yugoslavia |
Incubation Period |
Range |
|||||||
Gear1975 |
South Africa |
Incubation Period |
Range |
Healthcare workers |
Mid outbreak |
|||||
Knust2015 |
Uganda |
Time In Care |
14.3 |
Mean |
Range |
General population |
Post outbreak |
Other |
||
Bausch2006 |
Democratic Republic of the Congo |
Time Symptom To Careseeking |
4.5 |
Median |
Range |
Other |
Mid outbreak |
|||
Gear1975 |
South Africa |
Time Symptom To Careseeking |
4.0 |
Other |
Other |
Start outbreak |
||||
Knust2015 |
Uganda |
Time Symptom To Careseeking |
4.0 |
Mean |
General population |
|||||
Ajelli2012 |
Angola |
Time Symptom To Outcome |
7.0 |
Median |
Range |
General population |
Mid outbreak |
Death |
||
Ajelli2012 |
Angola |
Time Symptom To Outcome |
9.0 |
Median |
Range |
General population |
Mid outbreak |
Death |
||
Gear1975 |
South Africa |
Time Symptom To Outcome |
9.0 |
Other |
Start outbreak |
Other |
||||
Knust2015 |
Uganda |
Time Symptom To Outcome |
9.0 |
Mean |
Range |
General population |
Post outbreak |
Death |
||
Knust2015 |
Uganda |
Time Symptom To Outcome |
22.0 |
Mean |
Range |
General population |
Other |
|||
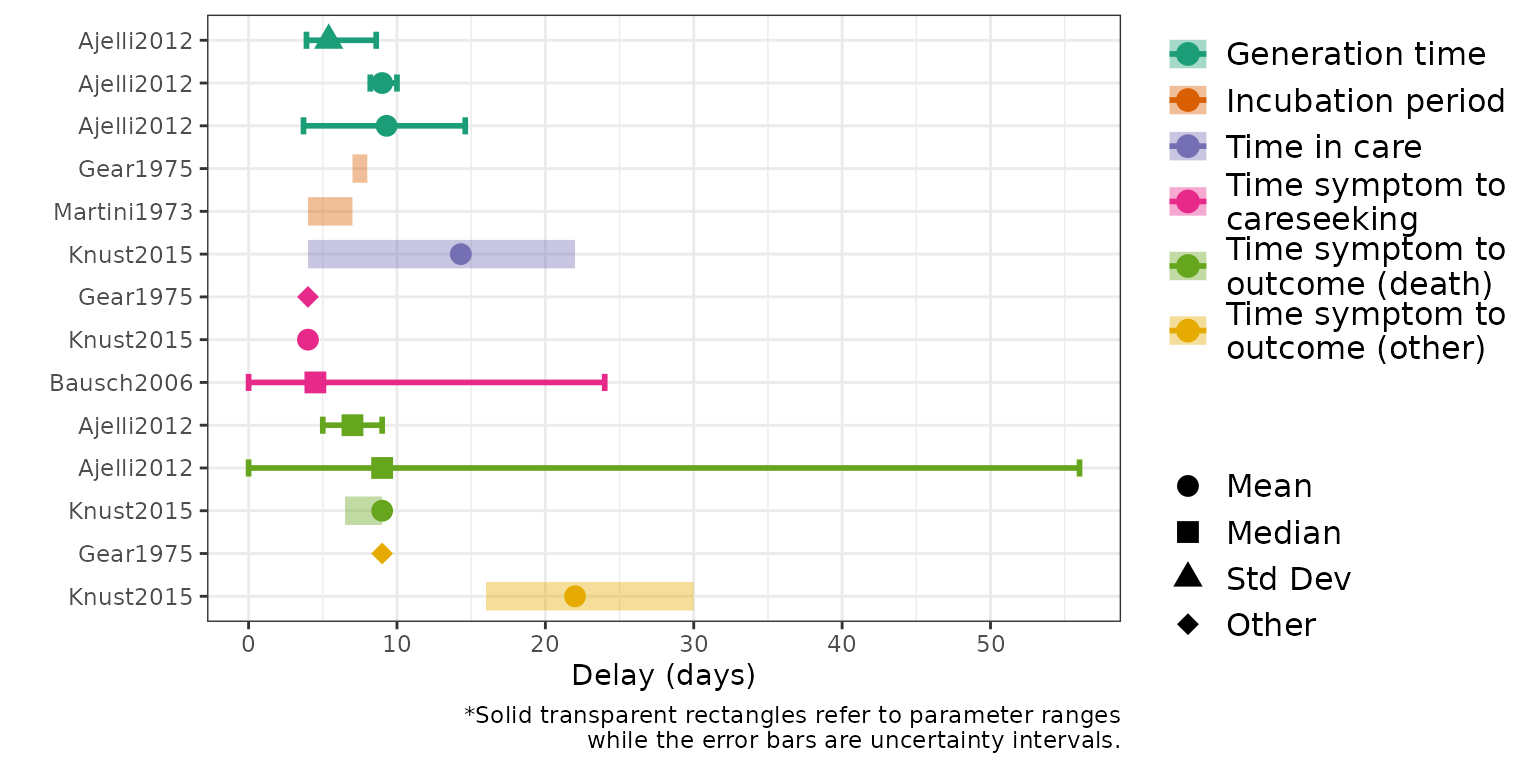
Figure 3 (B): Delay parameters, stratified into five categories: Generation Time, Incubation Period, Time in Care, Time from Symptom to Careseeking and Time from Symptom to Outcome as indicated by different colours.
Seroprevalence
Table 4: Overview of seroprevalence estimates as reported in the included studies. Estimates were primarily reported as percentages, as shown here. Associated uncertainty and sample sizes are provided where these were reported. Where available, additional information regarding the location and timing of the estimates, the antibody being tested for, the target population, the timing in relation to any ongoing outbreak and the availability of disaggregated data is also summarised.
Article |
Country |
Parameter type* |
Seroprevalence (%) |
Uncertainty type |
Number Seropositive |
Sample size |
Population Group |
Timing of survey |
Disaggregated data |
||
|---|---|---|---|---|---|---|---|---|---|---|---|
Gonzalez1989 |
Cameroon,Central African Republic,Chad,Republic of the Congo,Equatorial Guinea,Gabon |
Unspecified |
0.39 |
20 |
5,070 |
General population |
Region |
||||
Johnson1993 |
Central African Republic |
IFA |
3 |
427 |
Outdoor workers |
||||||
Johnson1993 |
Central African Republic |
IFA |
3.20 |
Range |
137 |
4,295 |
General population |
Pre outbreak |
Age, Region, Sex |
||
Gonzalez2000 |
Central African Republic |
IgG |
2.40 |
Range |
33 |
1,340 |
|||||
Borchert2005 |
Democratic Republic of the Congo |
IFA |
0.00 |
Range |
0 |
300 |
Post outbreak |
||||
Bausch2003 |
Democratic Republic of the Congo |
IgG |
2.00 |
15 |
912 |
Mid outbreak |
|||||
Borchert2006 |
Democratic Republic of the Congo |
IgG |
1.65 |
CI95% |
Household contacts of survivors |
Post outbreak |
|||||
Borchert2007 |
Democratic Republic of the Congo |
IgG |
2.10 |
Healthcare workers |
Post outbreak |
||||||
Ivanoff1982 |
Gabon |
IFA |
0.00 |
0 |
197 |
||||||
Ivanoff1982 |
Gabon |
IFA |
0.00 |
0 |
28 |
Pregnant women |
|||||
Ivanoff1982 |
Gabon |
IFA |
0.00 |
0 |
28 |
Other |
|||||
Becker1992 |
Germany |
IgG |
2.60 |
Other |
|||||||
Johnson1983 |
Kenya |
IFA |
8 |
1,899 |
Region |
||||||
Johnson1983 |
Kenya |
IFA |
0.00 |
0 |
741 |
General population |
Post outbreak |
||||
Martini1973 |
Kenya |
Unspecified |
0 |
79 |
Other |
Post outbreak |
|||||
Smith1982 |
Kenya |
Unspecified |
2 |
186 |
Persons under investigation |
Post outbreak |
|||||
Smith1982 |
Kenya |
Unspecified |
3 |
100 |
Healthcare workers |
Post outbreak |
|||||
Smith1982 |
Kenya |
Unspecified |
0 |
224 |
General population |
Post outbreak |
|||||
Smith1982 |
Kenya |
Unspecified |
0 |
63 |
Other |
Post outbreak |
|||||
Smith1982 |
Kenya |
Unspecified |
0 |
79 |
Other |
Post outbreak |
|||||
Smith1982 |
Kenya |
Unspecified |
0 |
44 |
Outdoor workers |
Post outbreak |
|||||
Van der Waals1986 |
Liberia |
IFA |
1.30 |
3 |
225 |
Other |
Other |
Other, Region |
|||
Mathiot1989 |
Madagascar |
Unspecified |
0.00 |
0 |
381 |
Other |
Region |
||||
Tomori1988 |
Nigeria |
IFA |
1.70 |
29 |
1,677 |
General population |
|||||
Moyen2015 |
Republic of the Congo |
IgG |
0.50 |
Pre outbreak |
|||||||
Schoepp2014 |
Sierra Leone |
IgM |
3.60 |
Persons under investigation |
Other |
||||||
Rugarabamu2022 |
Tanzania |
IgM |
0.30 |
1 |
308 |
Other |
Region |
||||
Rodhain1989 |
Uganda |
HAI/HI |
4.50 |
6 |
132 |
||||||
Evans2018 |
Uganda |
IgG |
0 |
331 |
Other |
||||||
*HAI/HI: Hemagglutination Inhibition Assay; | |||||||||||
Molecular evolutionary rates
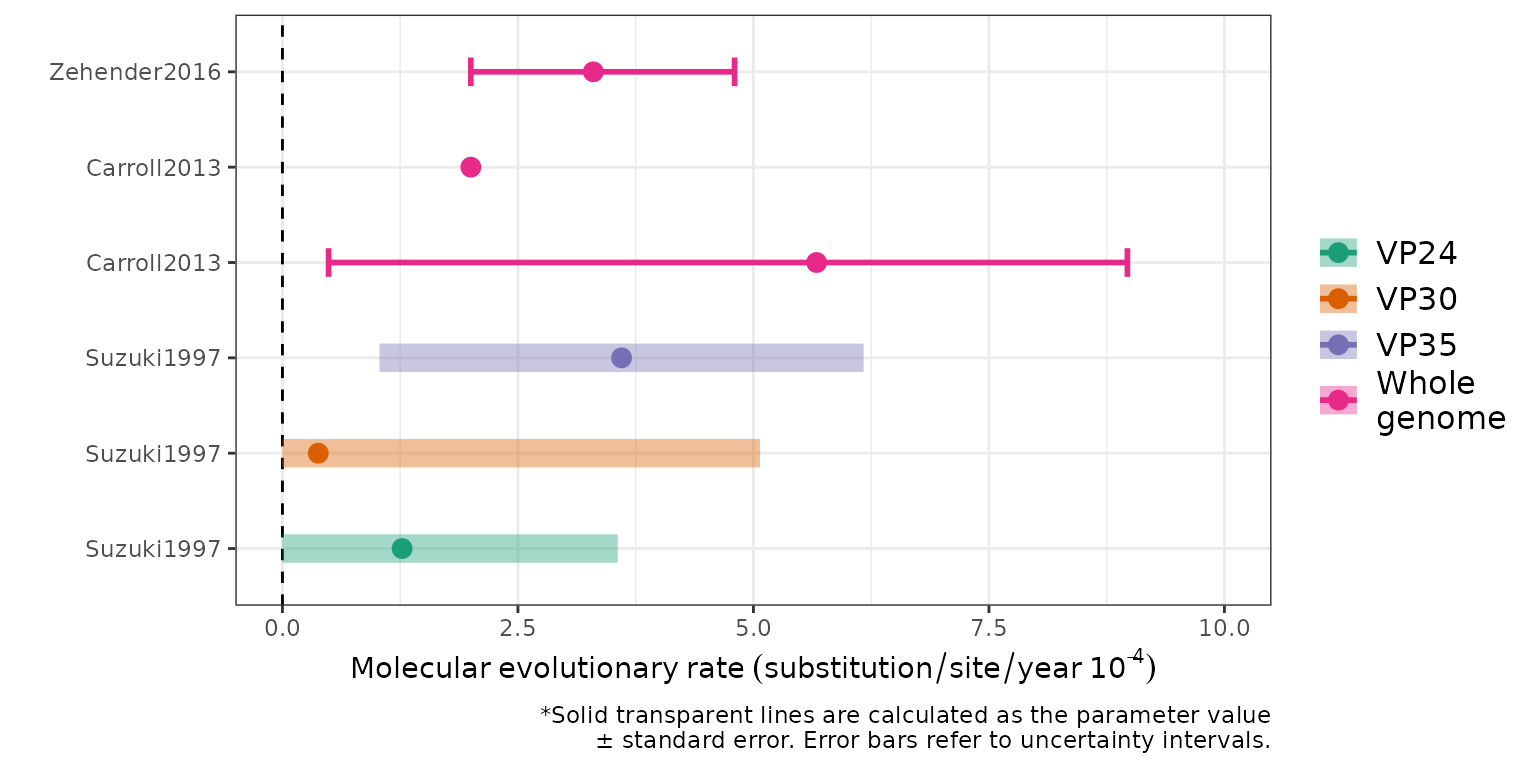
Figure 3 (C): Evolutionary rates. Colours indicate different genome types; points represent central estimates. Solid lines represent an uncertainty interval associated with the point estimate while ribbons indicate a parameter value +/- standard error with a minimum value of 0.
Risk Factors
Table 3: Aggregated information on risk factors associated with MVD infection and seropositivity. Risk factors were mapped onto our risk factor classification (see Supplement) by interpreting the authors’ descriptions. Adjusted refers to whether estimates are adjusted (i.e. from a multivariate analysis) or not (i.e. from a univariate analysis), with unknown showing that this information is not clearly stated in the original study. Statistical significance was determined according to the original authors’ statistical approaches when specified, or using a p-value of 0.05 otherwise. The numbers in the significant and not significant columns represent the total sample size included in the analyses for this risk factor and outcome category.
Outcome |
Risk factor |
Adjusted |
Significant |
Not significant |
|---|---|---|---|---|
Infection |
Contact with animal |
Unknown |
0 |
|
Infection |
Gathering |
Unknown |
128 |
|
Infection |
Household contact |
Unknown |
102 |
|
Infection |
Occupation - Funeral and burial services |
Unknown |
102 |
|
Infection |
Other |
Unknown |
102 |
26 |
Infection |
Sex |
Unknown |
26 |
|
Seropositivity |
Contact with animal |
Adjusted |
912 |
|
Seropositivity |
Contact with animal |
Unknown |
300 |
|
Seropositivity |
Gathering |
Unknown |
300 |
|
Seropositivity |
Hospitalisation |
Adjusted |
915 |
|
Seropositivity |
Household contact |
Adjusted |
912 |
|
Seropositivity |
Occupation - Funeral and burial services |
Adjusted |
912 |
Figure S4: More detailed table of risk factor data from the extracted studies, giving countries, times and contexts of surveys and non-aggregated information on each risk factor assessed in the four relevant studies.
Article |
Country |
Outcome |
Risk factor |
Significant |
Adjusted |
Sample size |
Population sample type |
Population group |
Timing of survey |
||
|---|---|---|---|---|---|---|---|---|---|---|---|
Borchert2005 |
Angola |
Infection |
Household contact |
Significant |
Unknown |
102 |
Hospital based |
Persons under investigation |
Mid outbreak |
||
Borchert2005 |
Angola |
Infection |
Other |
Significant |
Unknown |
102 |
Hospital based |
Persons under investigation |
Mid outbreak |
||
Borchert2005 |
Angola |
Infection |
Gathering |
Significant |
Unknown |
102 |
Hospital based |
Persons under investigation |
Mid outbreak |
||
Borchert2005 |
Angola |
Infection |
Occupation - Funeral and burial services |
Significant |
Unknown |
102 |
Hospital based |
Persons under investigation |
Mid outbreak |
||
Amman2012 |
Uganda |
Infection |
Contact with animal |
Significant |
Unknown |
||||||
Amman2012 |
Uganda |
Infection |
Other |
Significant |
Unknown |
||||||
Knust2015 |
Uganda |
Infection |
Gathering |
Significant |
Unknown |
26 |
Community based |
General population |
Post outbreak |
||
Knust2015 |
Uganda |
Infection |
Other |
Not significant |
Unknown |
26 |
Community based |
General population |
Post outbreak |
||
Knust2015 |
Uganda |
Infection |
Sex |
Not significant |
Unknown |
26 |
Community based |
General population |
Post outbreak |
||
Bausch2003 |
Democratic Republic of the Congo |
Serology |
Contact with animal |
Not significant |
Adjusted |
912 |
Population based |
||||
Bausch2003 |
Democratic Republic of the Congo |
Serology |
Household contact |
Not significant |
Adjusted |
912 |
Population based |
||||
Bausch2003 |
Democratic Republic of the Congo |
Serology |
Occupation - Funeral and burial services |
Not significant |
Adjusted |
912 |
Population based |
||||
Bausch2003 |
Democratic Republic of the Congo |
Serology |
Hospitalisation |
Significant |
Adjusted |
915 |
Population based |
||||
Borchert2005 |
Democratic Republic of the Congo |
Serology |
Contact with animal |
Not significant |
Unknown |
300 |
Community based |
Post outbreak |
|||
Borchert2005 |
Democratic Republic of the Congo |
Serology |
Gathering |
Not significant |
Unknown |
300 |
Community based |
Post outbreak |
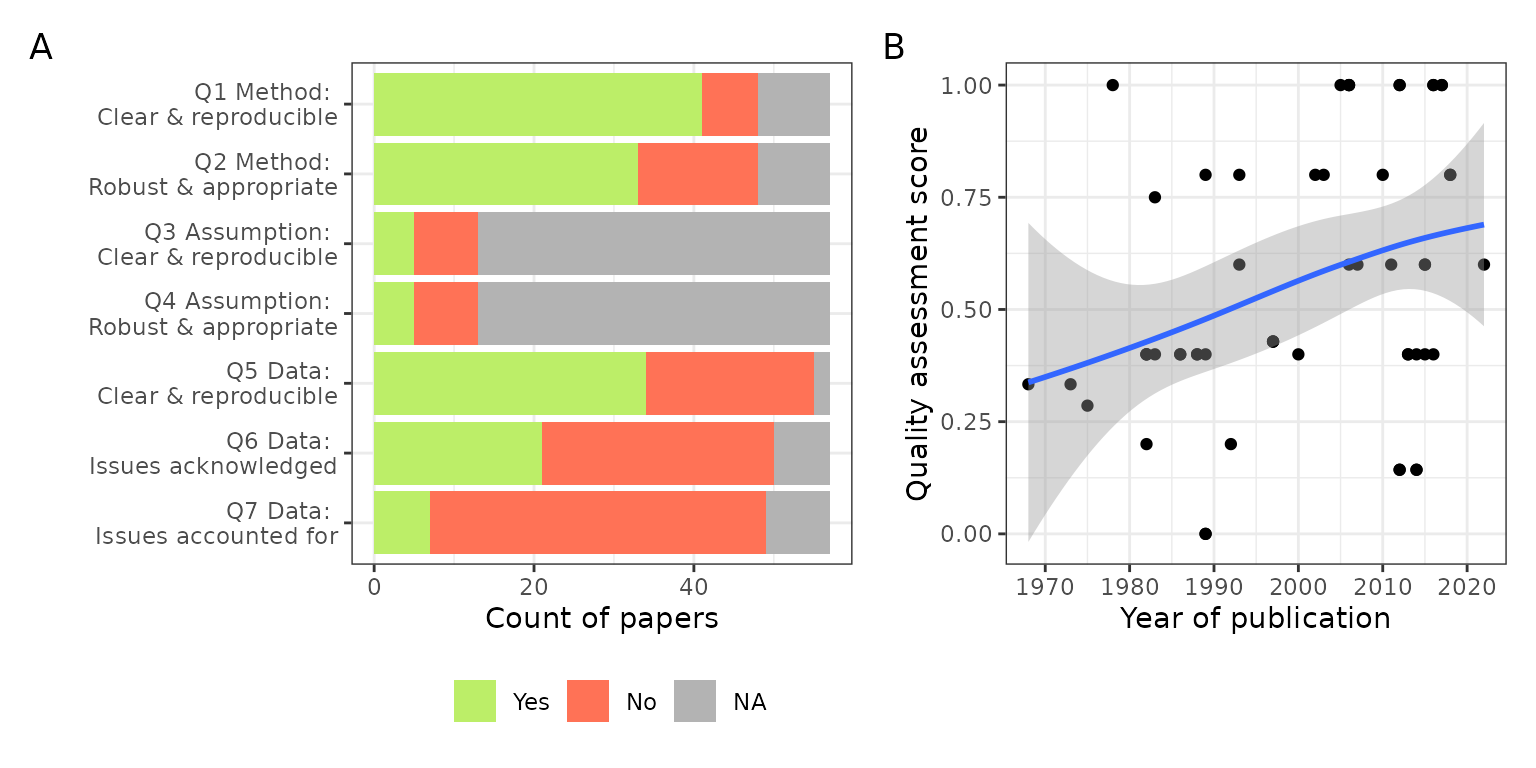
Quality Assessment
Figure S3: (A) Count of papers for each quality assessment question scoring Yes, No or not applicable. (B) Quality Assessment Score defined as proportion of Yes votes for each paper relative to sum of Yes and No answers, removing NAs. The time trend is fitted using Local Polynomial Regression Fitting.