Plot the immunity or population size of a popim_population object
plotting.RdPlot the immunity or population size of a popim_population object
Arguments
- pop
popim_populationobject such as created bypopim_population().- cols
vector of 2 colours to be used to generate the (continuous) colour palette for plotting. Defaults to
c("whitesmoke", "midnightblue").- rel
logical to indicate whether to use relative or absolute population size in
plot_pop_size(). Defaults to FALSE (plotting absolute population size).
Value
A ggplot object.
Details
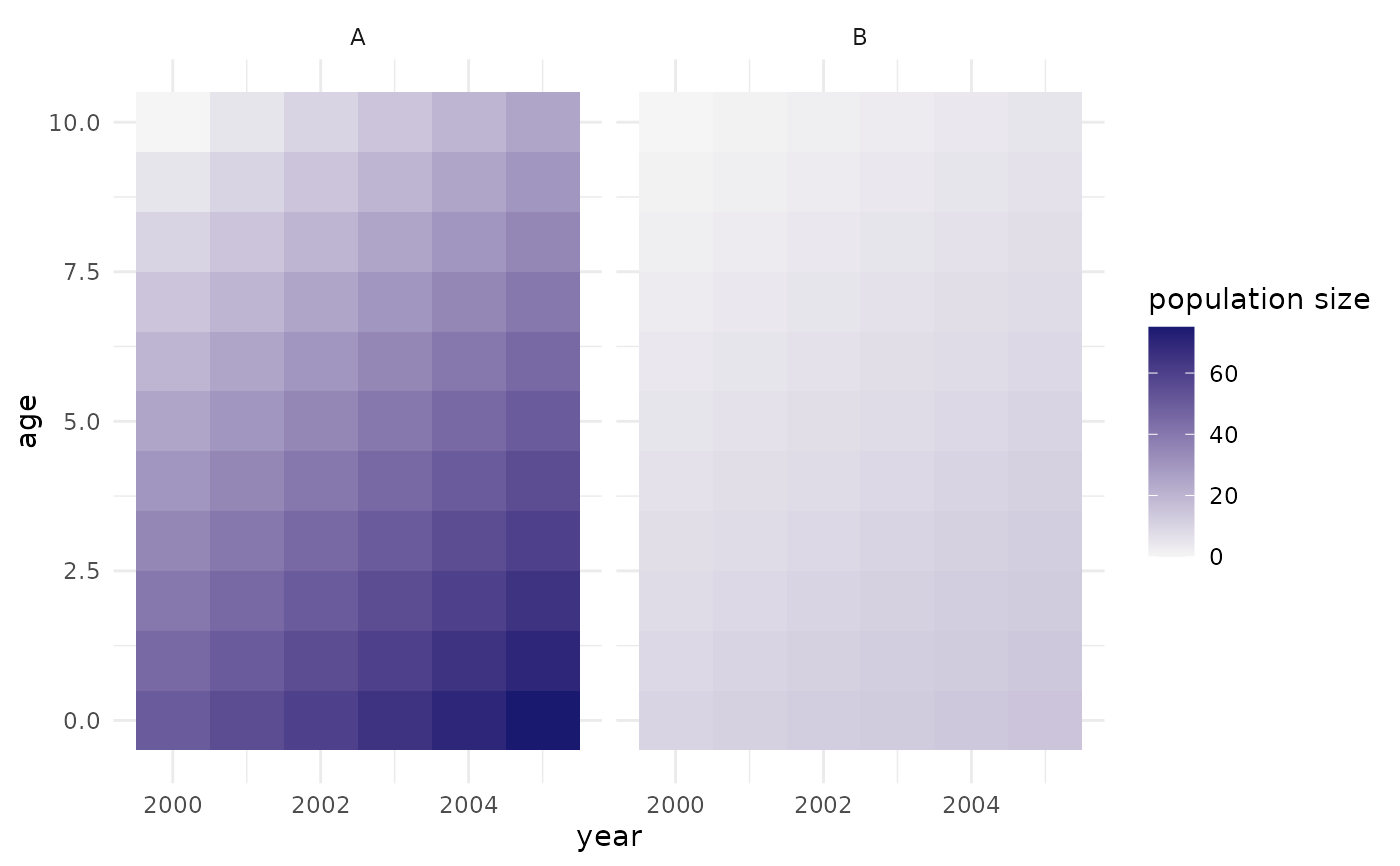
The population is displayed in a grid showing the cohorts through time. Time is shown on the x-axis, age on the y-axis, such that a particular cohort tracks along diagonally from bottom left to top right. If there are several regions, these are shown as separate facets.
The colour in each cell corresponds to:
for
plot_immunity(): the proportion of each cohort that is immune, therefore varying between 0 and 1.for
plot_pop_size(rel = FALSE): the absolute size of each cohort.for
plot_pop_size(rel = TRUE): the cohort size divided by the maximum total population size (aggregated across all cohorts) reached at any point in time for each region in question.
As the returned object is a regular ggplot object, it can be
further modified with the ususal ggplot2 syntax.
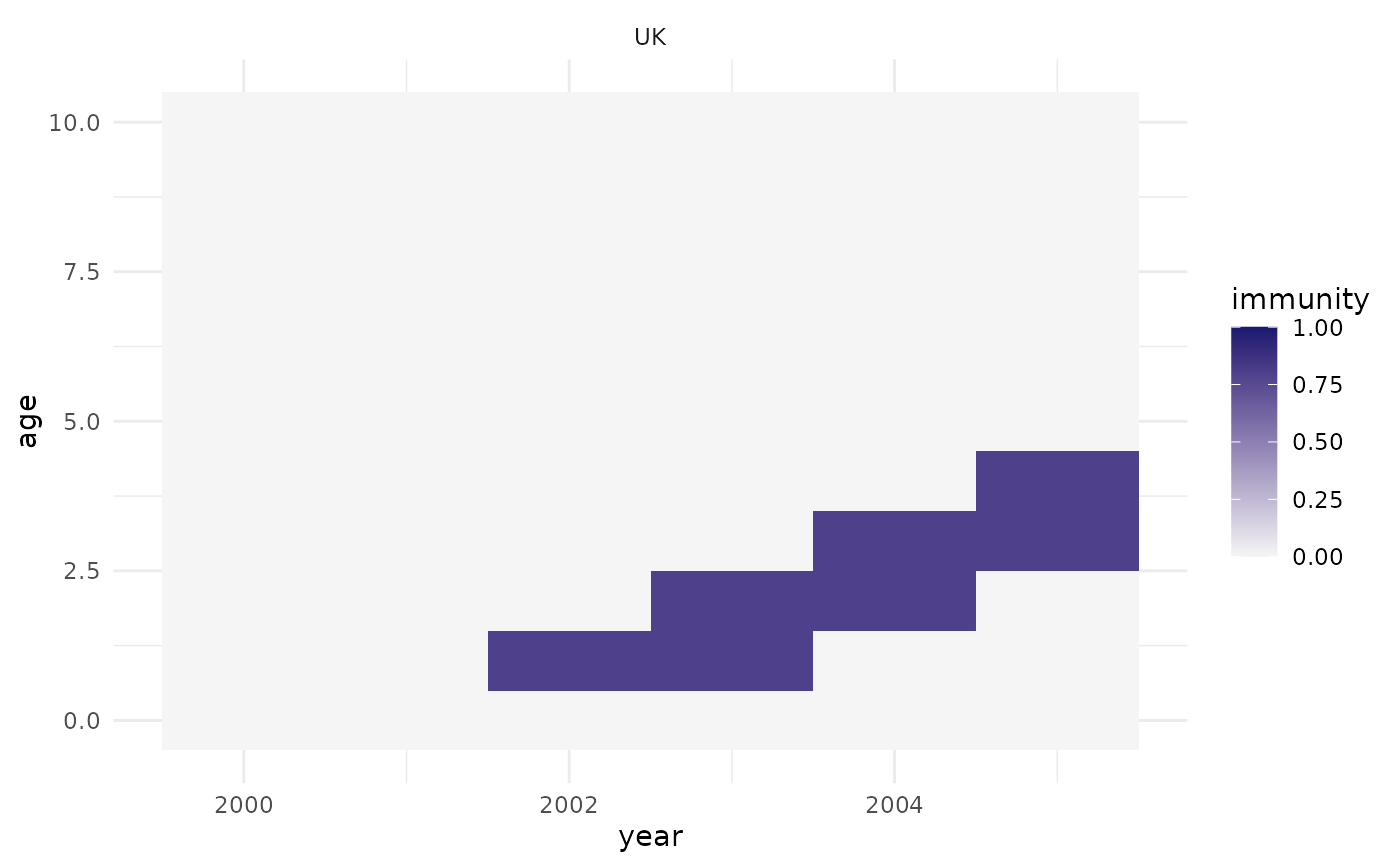
Examples
## set up population and vaccination activities:
pop <- popim_population(region = "UK", year_min = 2000, year_max = 2005,
age_min = 0, age_max = 10)
vacc <- popim_vacc_activities(region = "UK", year = c(2001, 2002),
age_first = 0, age_last = 0,
coverage = 0.8, doses = NA,
targeting = "random")
## update the population immunity based on the vaccination activities:
pop <- apply_vacc(pop, vacc)
## plot the population immunity by age and time:
plot_immunity(pop)
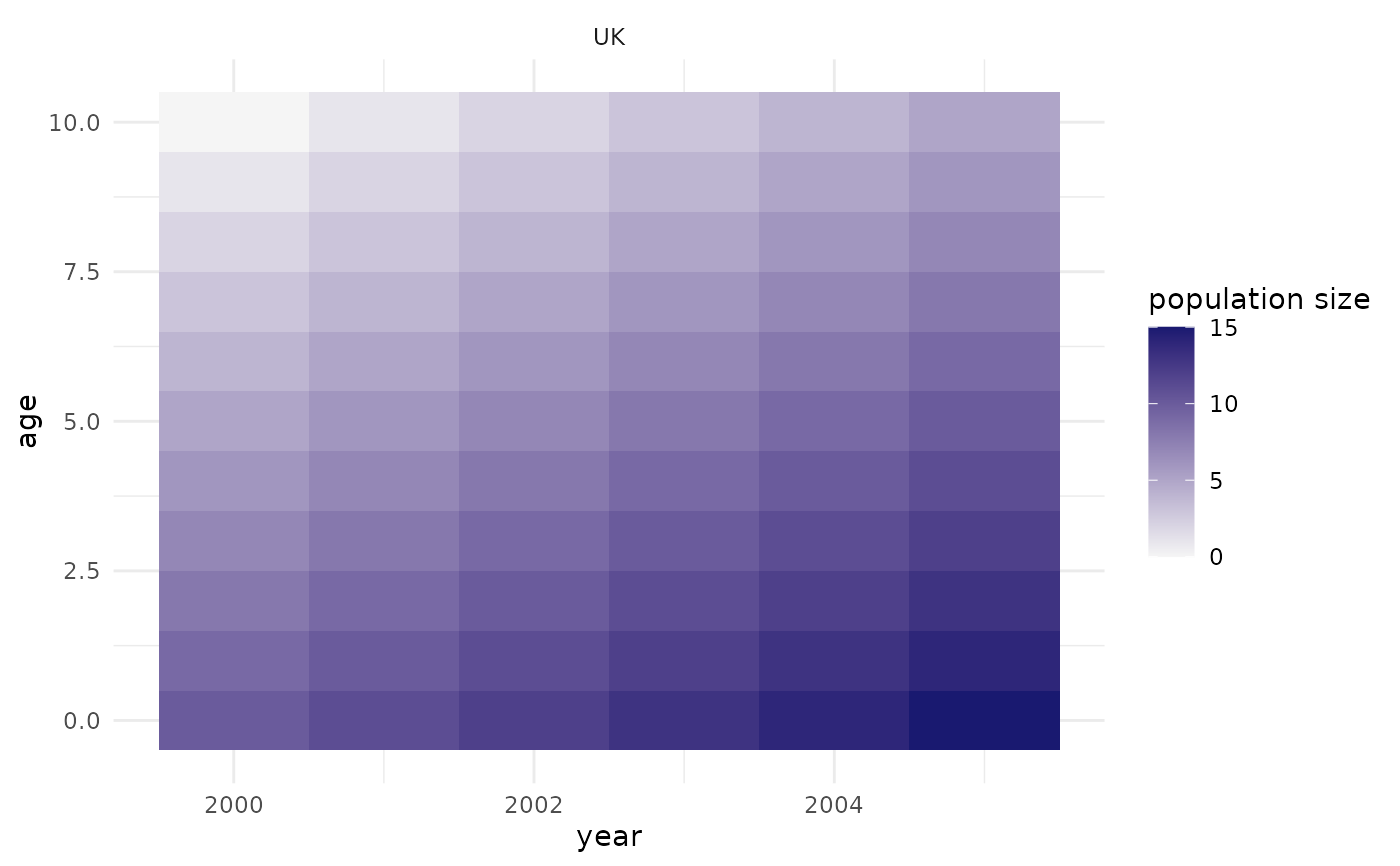
 ## adding some population size manually:
pop$pop_size <- pop$cohort - 1990
## plot the population size by age and time:
plot_pop_size(pop)
## adding some population size manually:
## adding some population size manually:
pop$pop_size <- pop$cohort - 1990
## plot the population size by age and time:
plot_pop_size(pop)
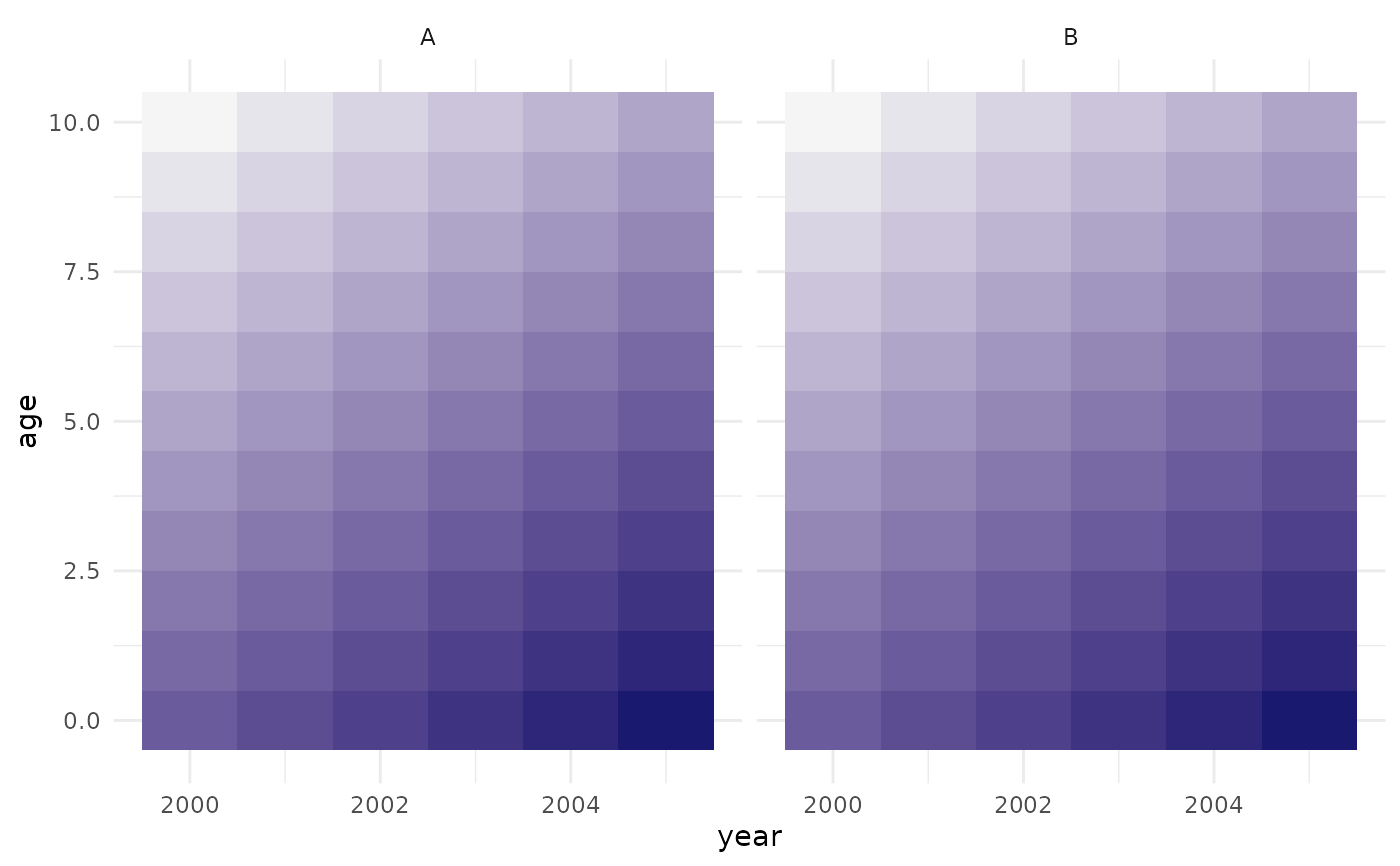
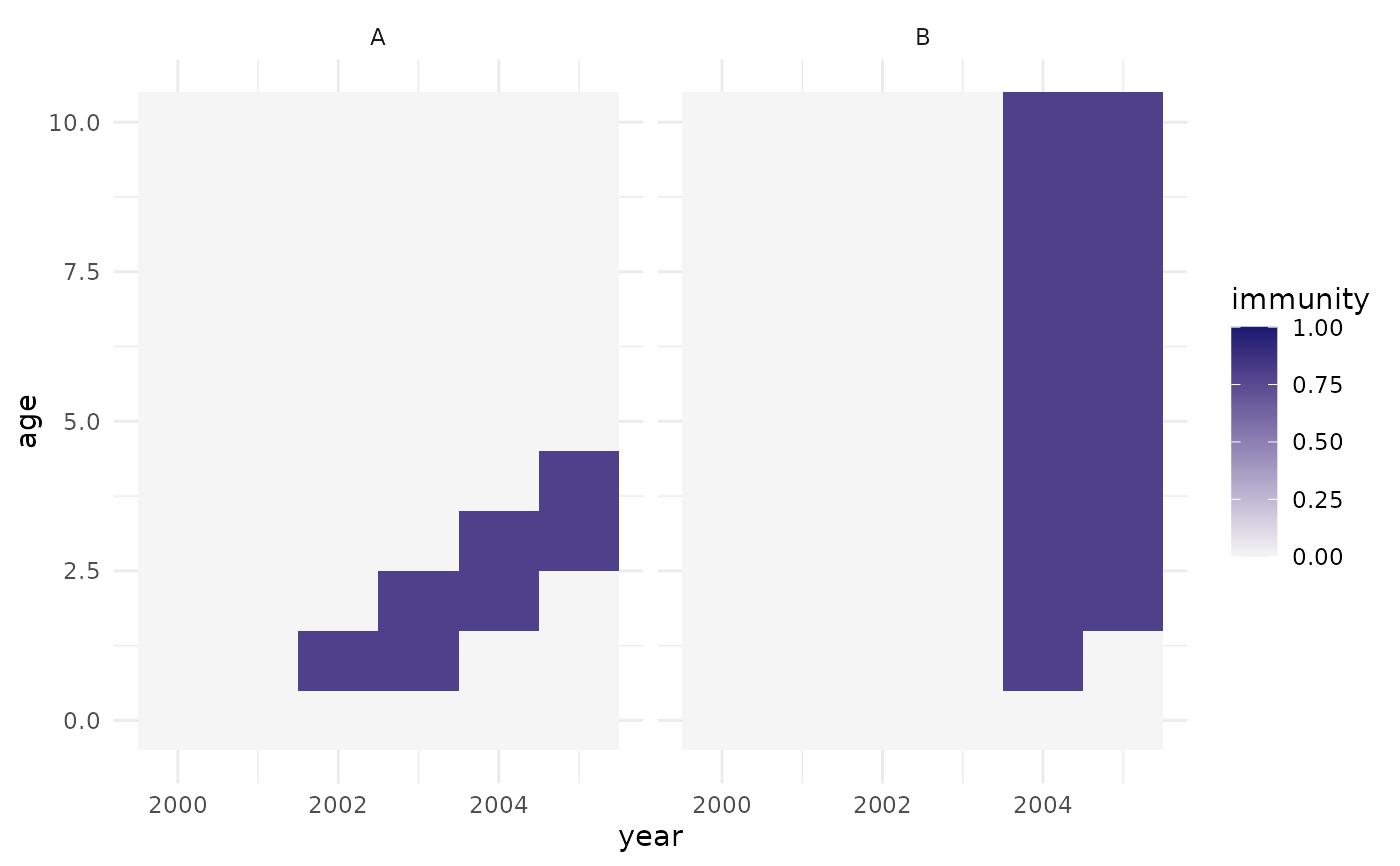
 ##-----------------------------------------------------------------------
## setting up a population with multiple regions:
pop <- popim_population(region = c("A", "B"),
year_min = 2000, year_max = 2005,
age_min = 0, age_max = 10)
pop$pop_size <- pop$cohort - 1990
pop$pop_size[pop$region == "A"] <- 5 * pop$pop_size[pop$region == "A"]
## adding some vaccination activities:
vacc <- popim_vacc_activities(region = c("A", "A", "B"),
year = c(2001, 2002, 2003),
age_first = c(0,0,0), age_last = c(0,0,10),
coverage = 0.8, doses = NA,
targeting = "random")
pop <- apply_vacc(pop, vacc)
plot_immunity(pop)
##-----------------------------------------------------------------------
## setting up a population with multiple regions:
pop <- popim_population(region = c("A", "B"),
year_min = 2000, year_max = 2005,
age_min = 0, age_max = 10)
pop$pop_size <- pop$cohort - 1990
pop$pop_size[pop$region == "A"] <- 5 * pop$pop_size[pop$region == "A"]
## adding some vaccination activities:
vacc <- popim_vacc_activities(region = c("A", "A", "B"),
year = c(2001, 2002, 2003),
age_first = c(0,0,0), age_last = c(0,0,10),
coverage = 0.8, doses = NA,
targeting = "random")
pop <- apply_vacc(pop, vacc)
plot_immunity(pop)
 plot_pop_size(pop)
 plot_pop_size(pop, rel = TRUE)