Construct a piecewise constant quantity over time array for use within sircovid models.
sircovid_parameters_piecewise_constant(date, value, dt)Arguments
- date
Either
NULL, if one value of the quantity will be used for all time steps, or a vector of times that will be used as change points. Must be provided as asircovid_date(), i.e., days into 2020. The first date must be 0.- value
A vector of values to use for the quantity - either a scalar (if
dateisNULL) or a vector the same length asdate.- dt
The timestep that will be used in the simulation. This must be of the form
1 / nwherenis an integer representing the number of steps per day. Ordinarily this is set by sircovid internally to be0.25but this will become tuneable in a future version.
Value
Returns a vector of piecewise constant values, one per timestep, until the values stabilise. After this point the quantity is assumed to be constant.
Examples
# If "date" is NULL, then the quantity is constant and this function is
# trivial:
sircovid::sircovid_parameters_piecewise_constant(NULL, 0.1, 0.25)
#> [1] 0.1

date <- sircovid::sircovid_date(
   c("2019-12-31", "2020-02-01", "2020-02-14", "2020-03-15"))
value <- c(0, 3, 1, 2)
y <- sircovid::sircovid_parameters_piecewise_constant(date, value, 1)

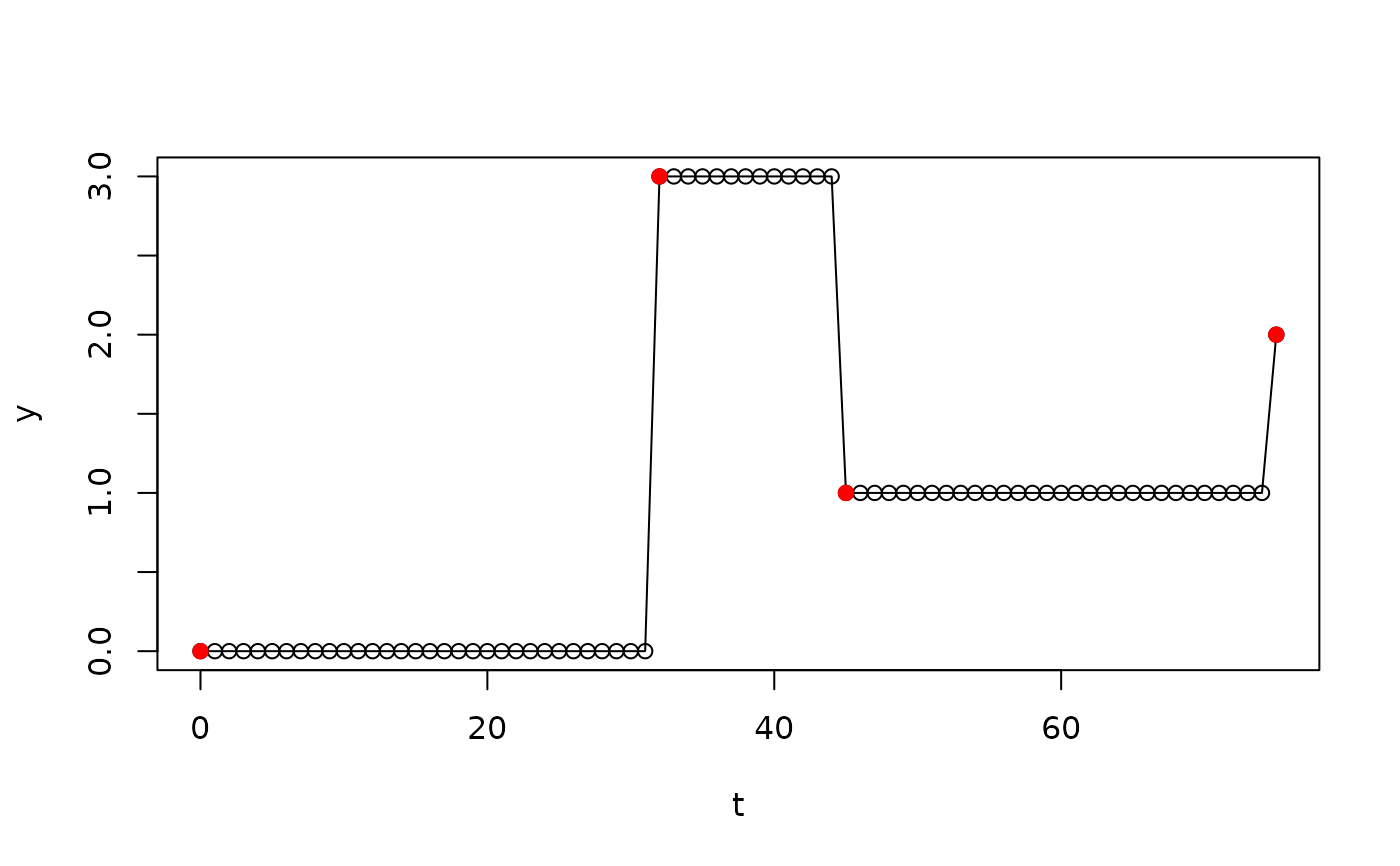
# The implied time series looks like this:
t <- seq(0, date[[4]])
plot(t, y, type = "o")
points(date, value, pch = 19, col = "red")


# After 2020-03-15, the quantity value will be fixed at 2, the value
# that it reached at that date.

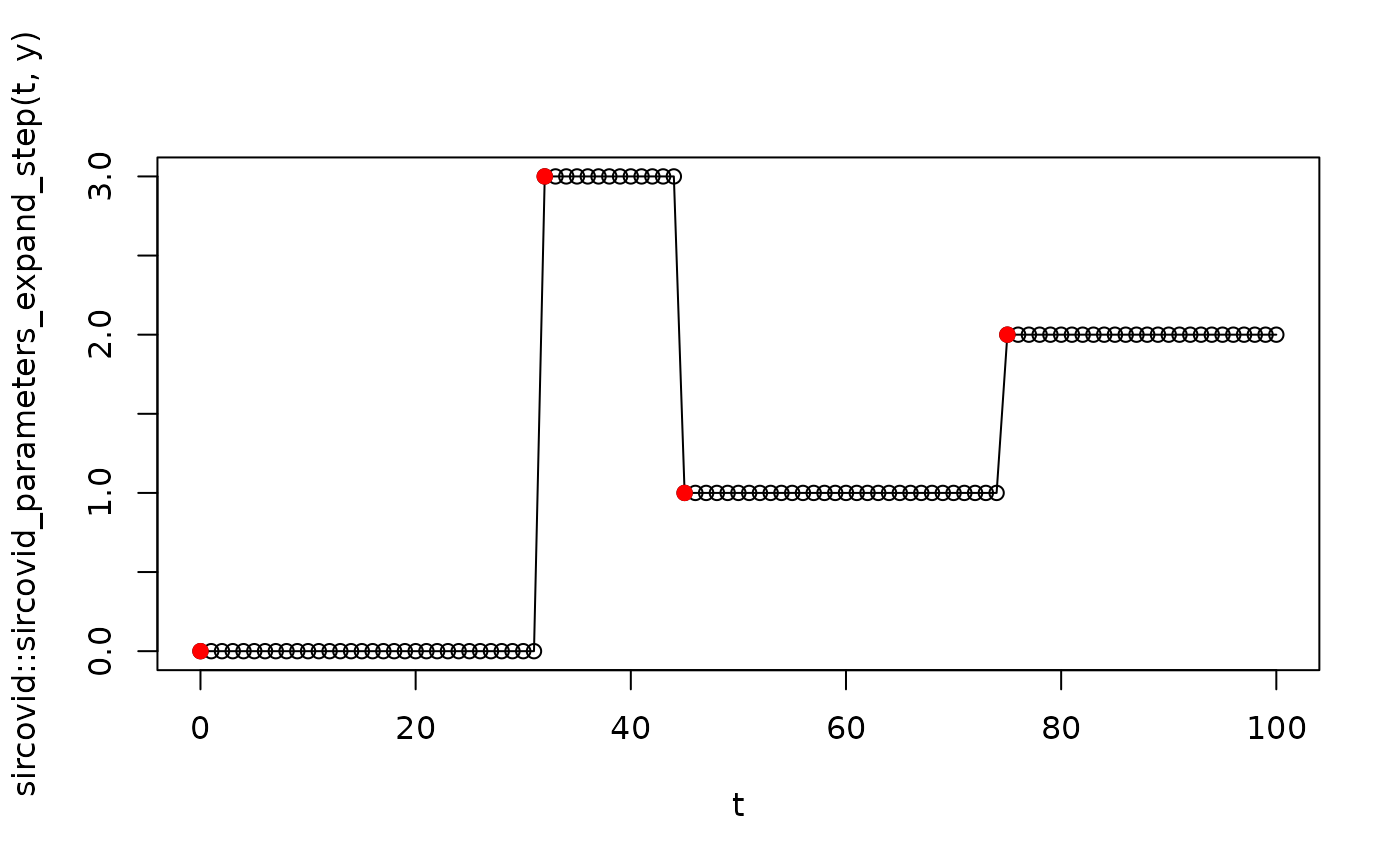
# You can see this using sircovid_parameters_expand_step
# If a vector of dates is provided then, it's more complex. We'll
# use dt of 1 here as it's easier to visualise
t <- seq(0, 100, by = 1)
sircovid::sircovid_parameters_expand_step(t, y)
#>   [1] 0 0 0 0 0 0 0 0 0 0 0 0 0 0 0 0 0 0 0 0 0 0 0 0 0 0 0 0 0 0 0 0 3 3 3 3 3
#>  [38] 3 3 3 3 3 3 3 3 1 1 1 1 1 1 1 1 1 1 1 1 1 1 1 1 1 1 1 1 1 1 1 1 1 1 1 1 1
#>  [75] 1 2 2 2 2 2 2 2 2 2 2 2 2 2 2 2 2 2 2 2 2 2 2 2 2 2 2
plot(t, sircovid::sircovid_parameters_expand_step(t, y), type = "o")
points(date, value, pch = 19, col = "red")


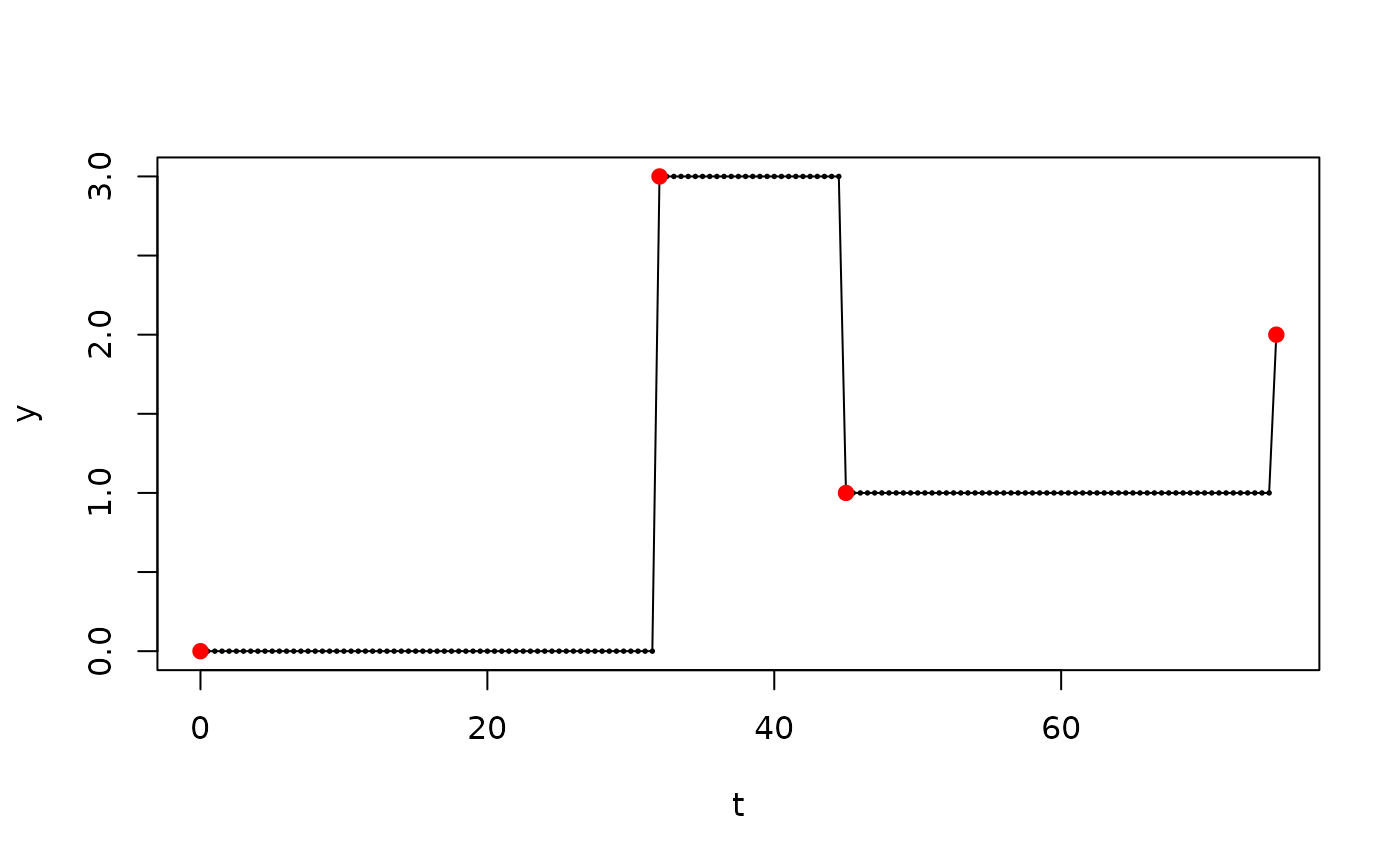
# If dt is less than 1, this is scaled, but the pattern of
# change is the same
y <- sircovid::sircovid_parameters_piecewise_constant(date, value, 0.5)
t <- seq(0, date[[4]], by = 0.5)
plot(t, y, type = "o", cex = 0.25)
points(date, value, pch = 19, col = "red")
